Fęrsluflokkur: Umhverfismįl
Fimmtudagur, 3. desember 2015
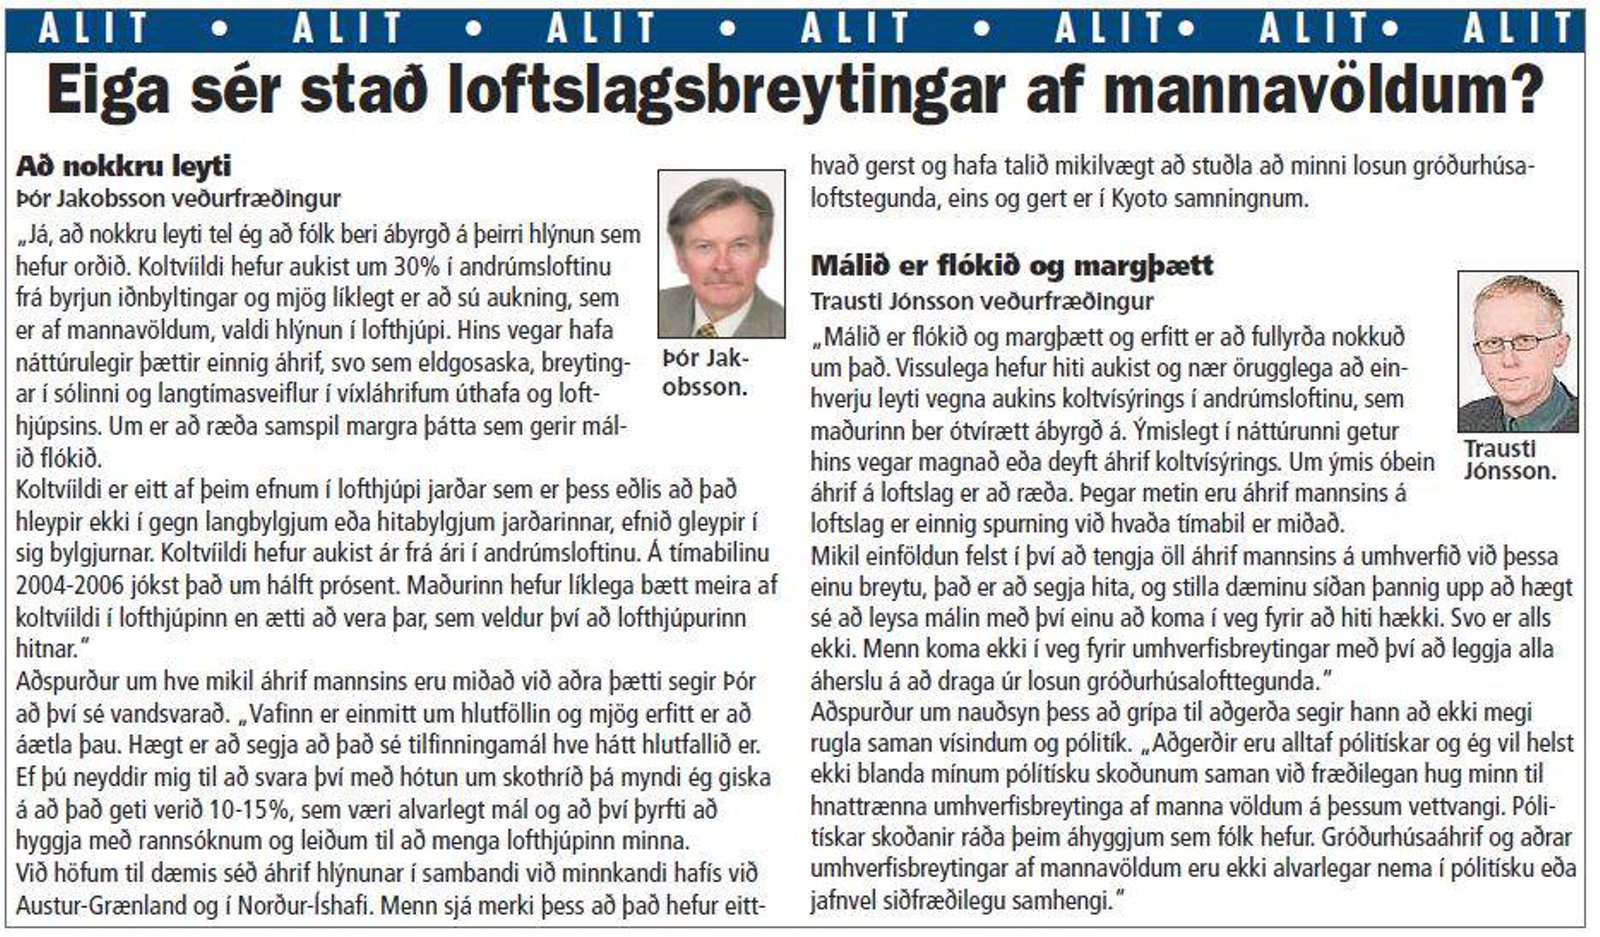
Eiga sér staš loftslagsbreytingar af mannavöldum...?
Śr Višskiptablašinu 13. desember 2006
Fyrir um įratug var stutt vištal viš žessa vķsindamenn sem teljast verša vera mešal žeirra reyndustu į sviši vešur- og loftslagsfręša hér į landi.
Žór: "Um er aš ręša samspil margra žįtta sem gerir mįliš flókiš".
Trausti: "Mįliš er flókiš og margžętt og erfitt aš fullyrša niokkuš um žaš".
Pįll Bergžórsson, okkar allra reyndasti og virtasti vešurfręšingur, er sama sinnis
og hefur birt įhugaveršar kenningar um įhrif hafķssins į svokallaša 60 įra sveiflu.
Allir eru žessir vķsindamenn sammįla um aš žaš hafi hlżnaš į undanförnum įratugum,
losun į koltvķildi hafi aukist verulega, en ekki sé hęgt aš kenna styrk
koltvķildis eingöngu um breytingar ķ hitafari, žó svo aš įhrif žess séu einhver.
Śr Morgunblašinu ķ dag 3. desember 2015
Eldri bloggpistlar sem fjalla um raunverulega "manngerša hlżnun":
Hvers vegna er NASA aš afmynda hitaferilinn fyrir Reykjavķk...?
Kann einhver skil į žessum undarlegheitum...?

NASA - GISS
Umhverfismįl | Breytt s.d. kl. 15:28 | Slóš | Facebook
Sunnudagur, 29. nóvember 2015
Hvaš er ešlilegt vešurfar...?
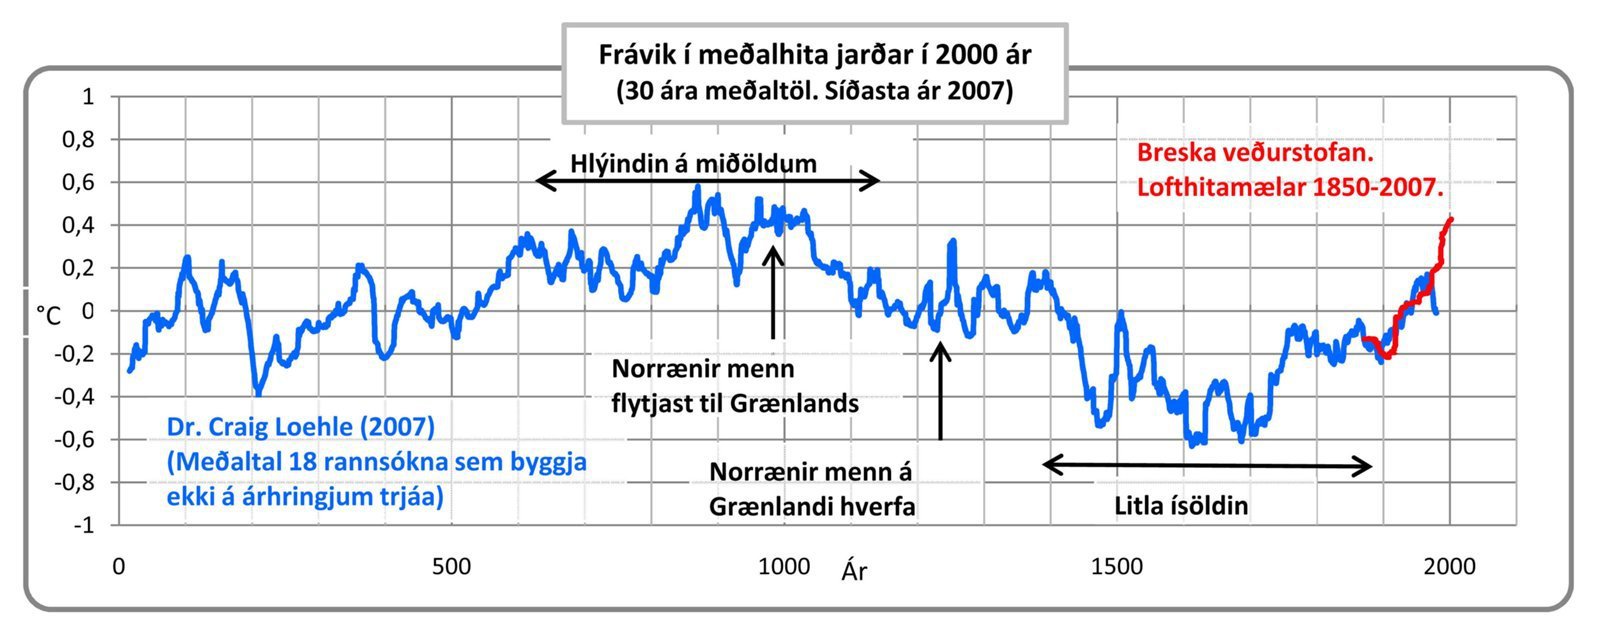
Er loftslag ešlilegt eins og žaš var fyrir 100 til 150 įrum? Žaš felst ķ kenningunni um skašlegar loftslagsbreytingar, ž.e. hlżnun frį žessu tķmabili. Jöršin hefur hlżnaš um 0,75 grįšur. Ķ žessu felst einnig aš loftslag hafi veriš ešlilegt į žeim tķma mešan losun manna į koltvķsżringi var enn óveruleg.
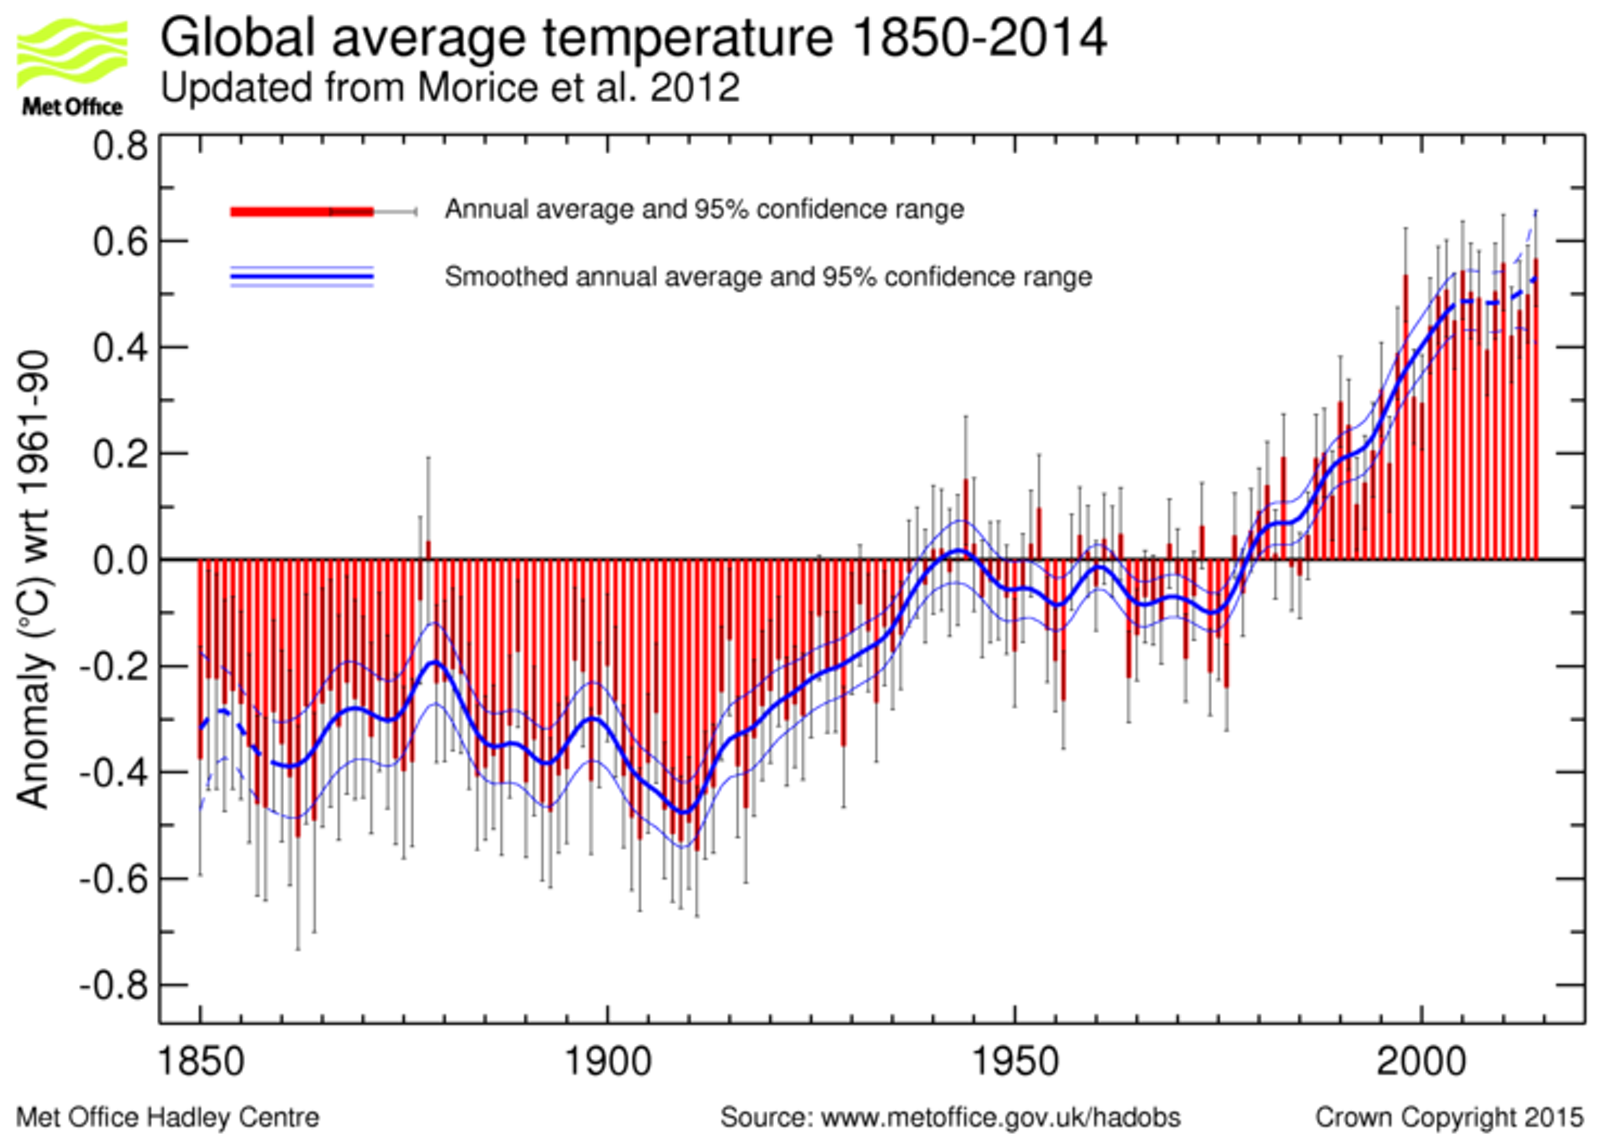
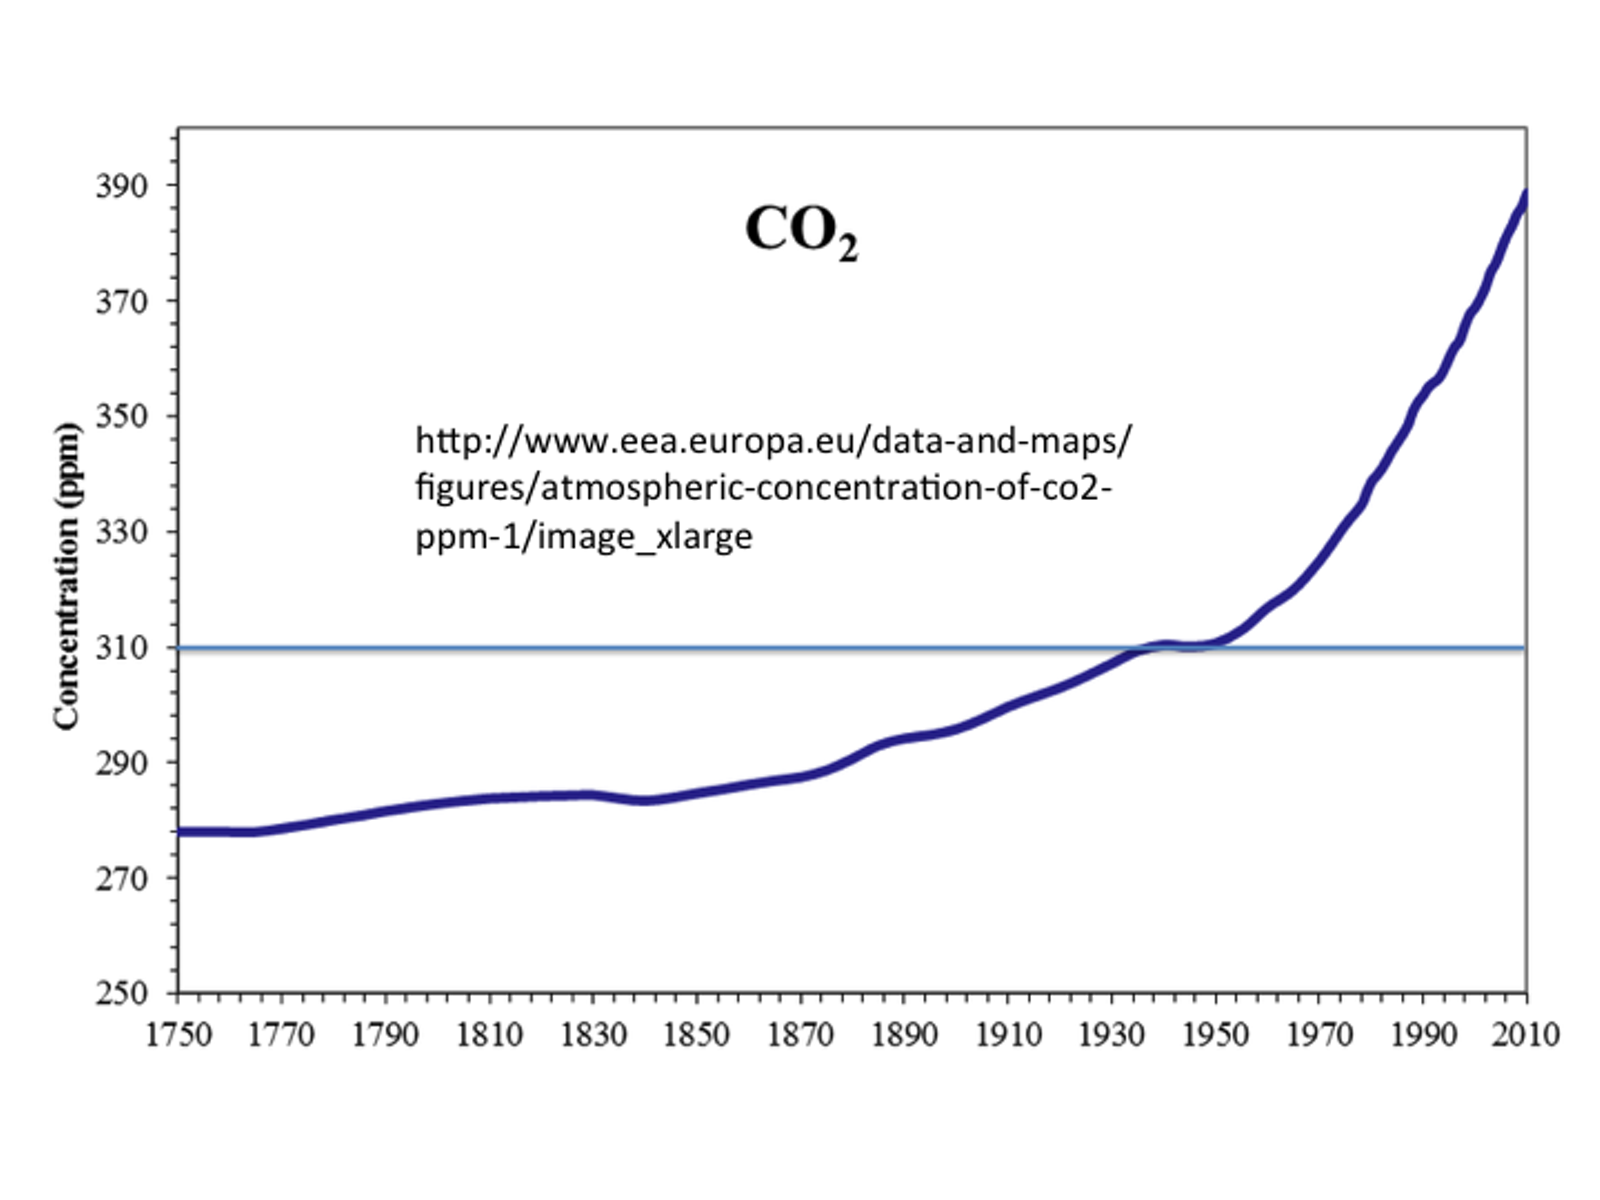
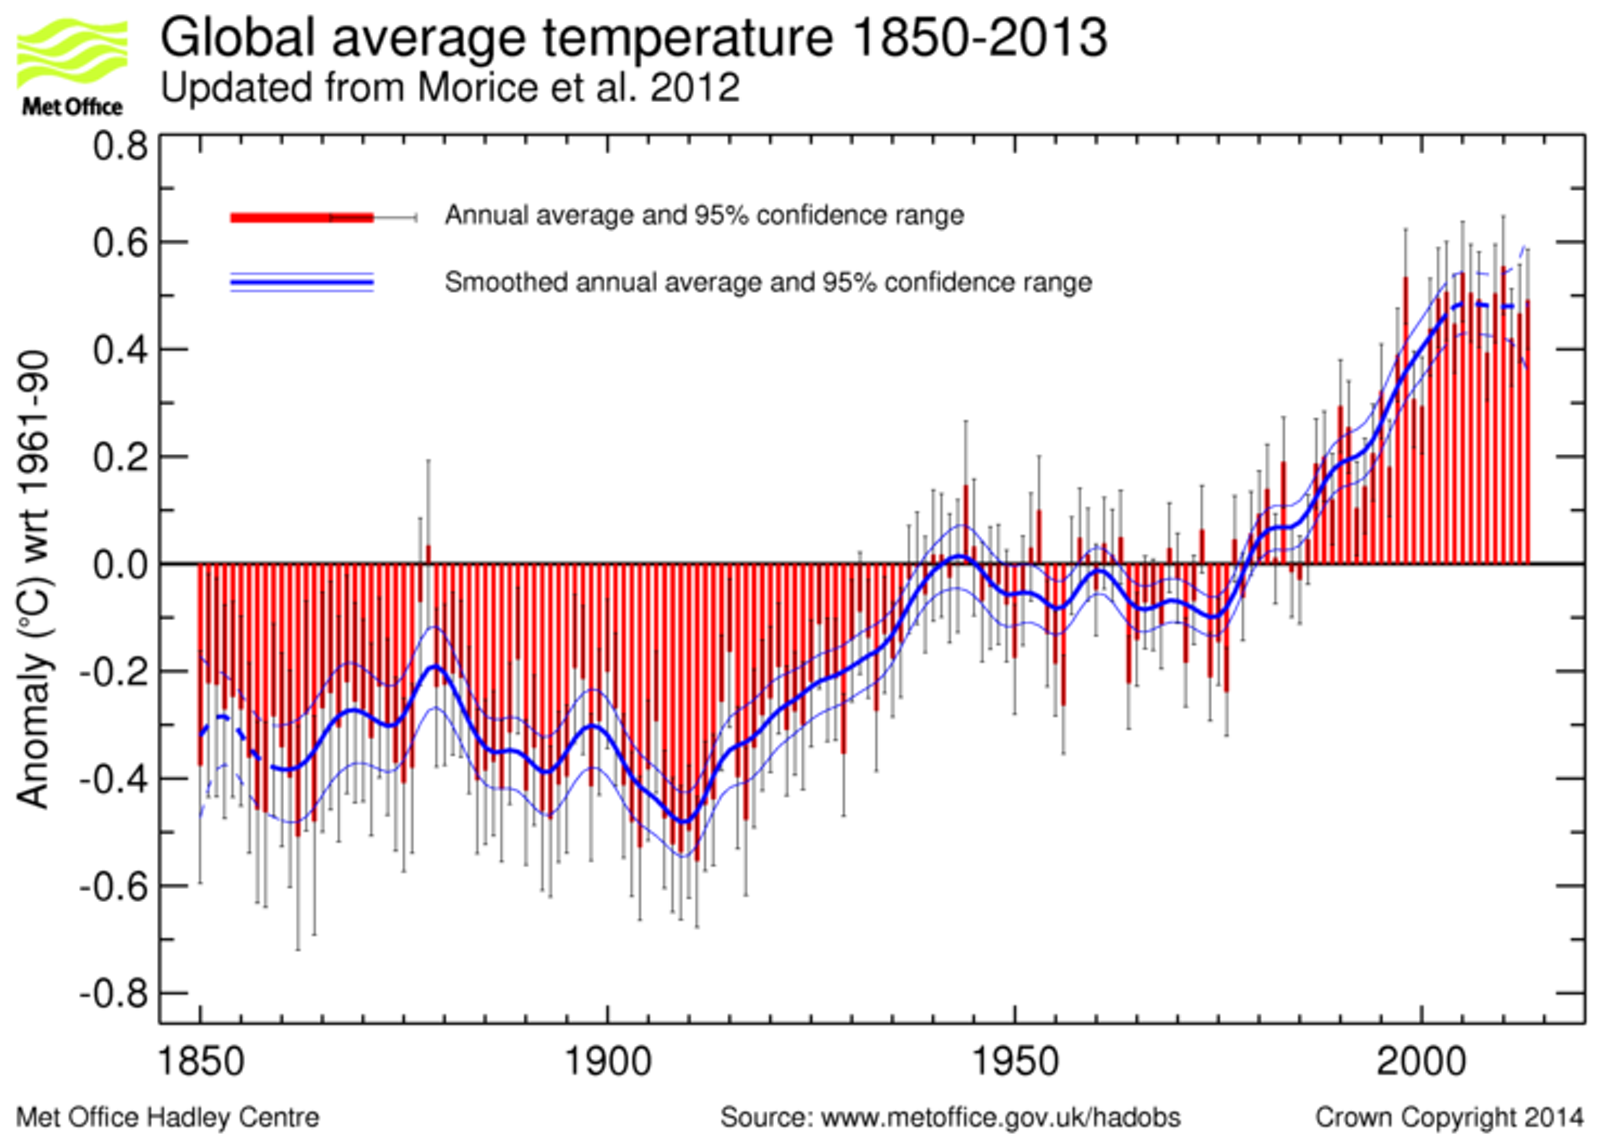
Samkvęmt męlingum er tališ aš hitastig jaršar hafi hękkaš um žvķ sem nęst 0,75°C sķšan um 1850. Kannski er žaš 0,8° afrśnnaš, en žaš skiptir litlu mįli žvķ óvissumörkin eru samkvęmt ferlinum +/- 0,2°. Hvers vegna 1850? Jś žaš er vegna žess aš sęmilega įreišanlegar eldri męlingar į lofthita eru ekki til. Žį var Litlu ķsöldinni ekki lokiš. Verulegur hluti žessa tķmabils, um žaš bil hįlf öld, tilheyrir Litlu ķsöldinni. Skekkir žaš ekki ašeins myndina? "Frį upphafi išnbyltingar (um 1750) hefur hlżnaš į jöršinni" mį lesa į Vķsindavefnum. Sé žessi tķmi notašur sem višmiš, žį tilheyra hvorki meira nį minna en 150 įr Litlu ķsöldinni! Menn hafa af žvķ miklar įhyggjur aš mešalhiti jaršar hafi hękkaš um žvķ sem nęst 0,8 grįšur į 150 įrum? Hver vill fullyrša aš um 1850, į sķšustu įratugum Litlu ķsaldar, hafi vešurfar veriš “rétt” og öll hękkun hita sķšan žį sé “röng” og hęttuleg? Žaš merkilega er aš žetta er kjarninn ķ umręšunni um loftslagsmįlin. (Ašeins er į reiki viš hvaša tķma hitahękkunin er mišuš. Stundum 1860, stundum 1880 og stundum 1910. Ķ žessu sambandi skiptir žaš ekki mįli, žvķ allt eru žetta tķmar sem tilheyra kuldatķmabili Litlu ķsaldar eins og greinilegt er ef myndin er skošuš. Žaš eru einnig skiptar skošanir um žaš hvenęr Litlu ķsöldinni lauk. Ķslenskir jöklar gengu lengst fram į tķmabilinu 1890-1920, sjį hér. Sumir miša viš 1850, en ašrir ekki fyrr en 1920). Viš sjįum greinilega į hitaferlinum frį Bresku Vešurstofunni aš Litlu Ķsöldinni lżkur ekki fyrr en um 1920, žį veršur mjög hröš hlżnun fram aš 1945, sķšan kyrrstaša til um 1975 er hitinn fer aš rķsa hratt til įrsins 2000, og aš lokum kyrrstaša til dagsins ķ dag. Eftirtektarvert er aš į tķmabilinu 1920 til 1945 er įlķka hröš og įlķka mikil hękkun į hitastigi og į tķmabilinu 1975 til 2000. Hvort tveggja 25 įra tķmabil. Žaš er umhugsunarvert aš losun manna į koltvķsżringi var tiltölulega lķtil fyrr en eftir mišja sķšustu öld er losunin fór hratt vaxandi. Sjį lķnuritiš meš CO2 hér fyrir nešan. Žaš flękir aušvitaš mįliš dįlķtiš. Var žaš kannski nįttśran sem var aš verki į fyrra tķmabilinu og mannfólkiš į hinu sķšara? Eša į nįttśran einhvern žįtt ķ hitabreytingunum yfir allt tķmabiliš?
Viš tökum eftir žvķ į myndinni frį Bresku vešurstofunni (Met Office) hér fyrir ofan aš mešalhitinn yfir allt tķmabiliš er nokkurn vegin sį sami og męldist ķ kyrrstöšunni 1945-1975. Reyndar er lįrétta lķnan viš 0,0°C örlķtiš ofar. Vęri ekki ešlilegra aš miša hękkun lofthitans viš žaš tķmabil frekar en Litlu Ķsöldina eins og gert er? Žį vęri hękkunin sem viš vęrum meš įhyggjur af um žaš bil 0,5° ķ staš 0,8°. Žaš munar um minna. Svo er ekki śtilokaš aš einhver hluti žessara 0,5 grįša séu ešlilegar sveiflur ķ nįttśrunni.
Ķ fyrirsögn žessa pistils stendur: Hvaš er ešlilegt vešurfar? Er žaš eins og žaš er ķ dag, eins og um mišja sķšustu öld, eša eins og į tķmum Charles Dickens? Svo viršist sem margir (flestir?) vilji aš hnattręnt loftslag verši aftur eins og žaš var į sķšustu įratugum Litlu ķsaldar, ž.e. į žeim įrum sem fjöldi Ķslendinga hélt til vesturheims ķ leit aš betra lķfi, en žaš er önnur saga...
|

|
„Žaš er ekkert plan B“ |
| Tilkynna um óvišeigandi tengingu viš frétt | |
Umhverfismįl | Breytt 1.12.2015 kl. 08:45 | Slóš | Facebook
Föstudagur, 20. nóvember 2015
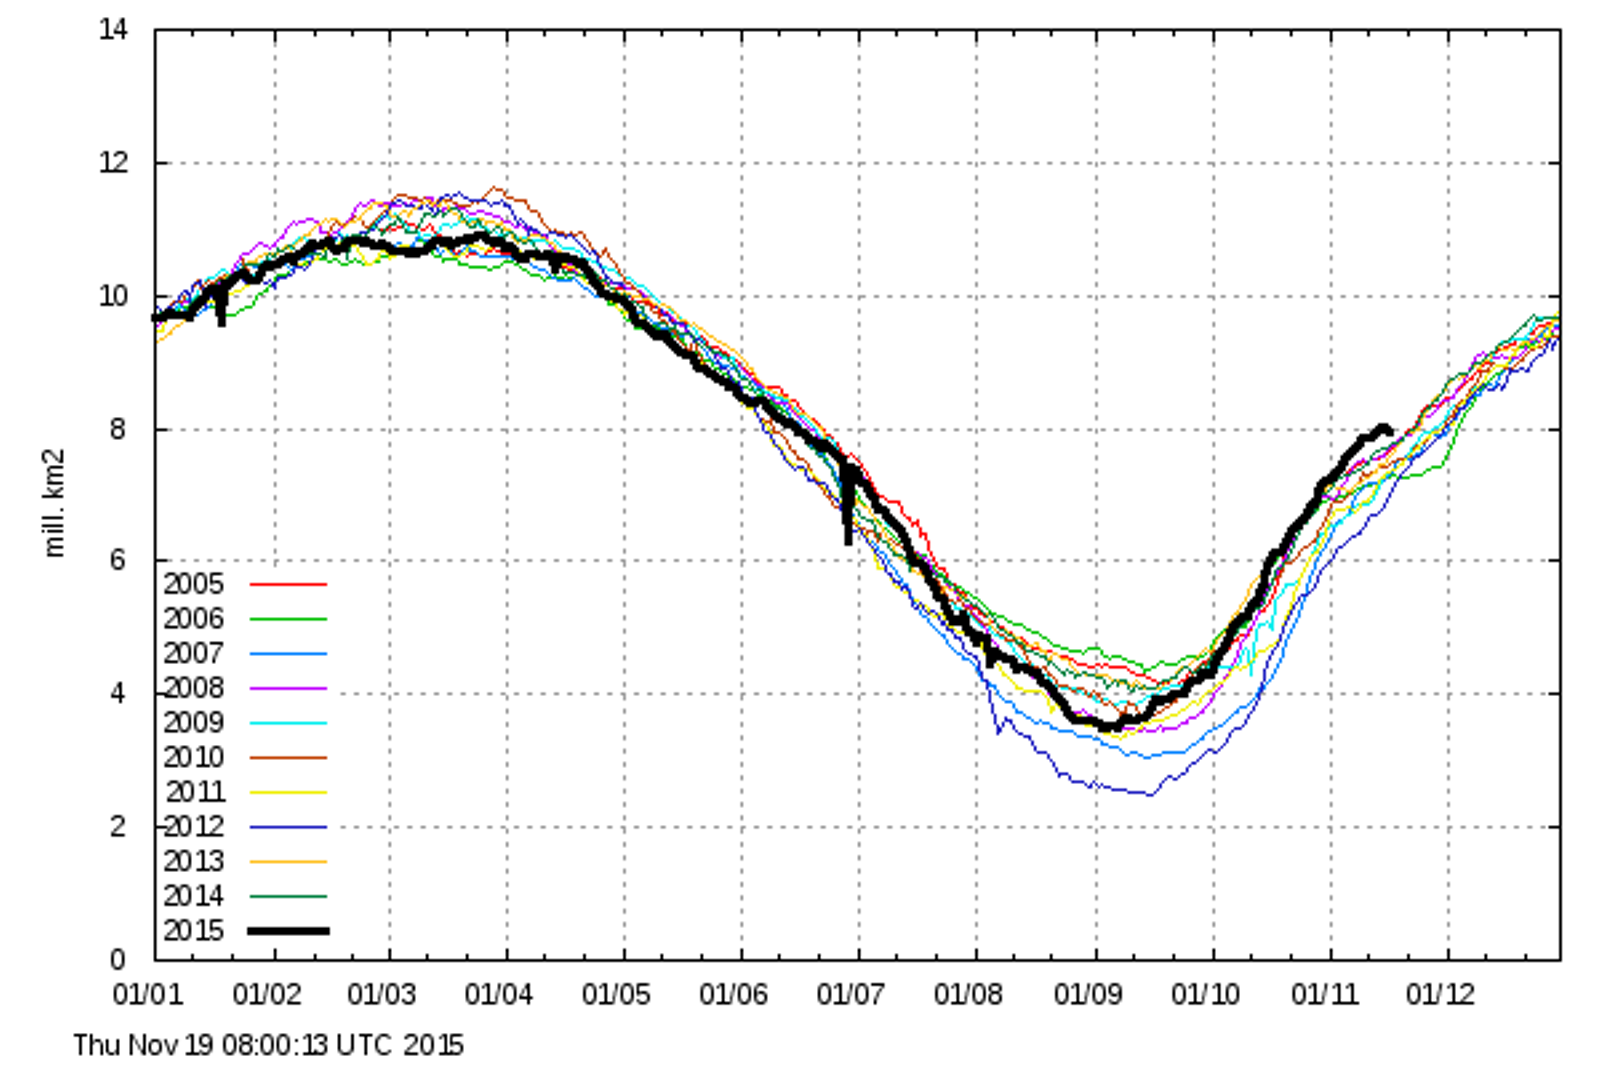
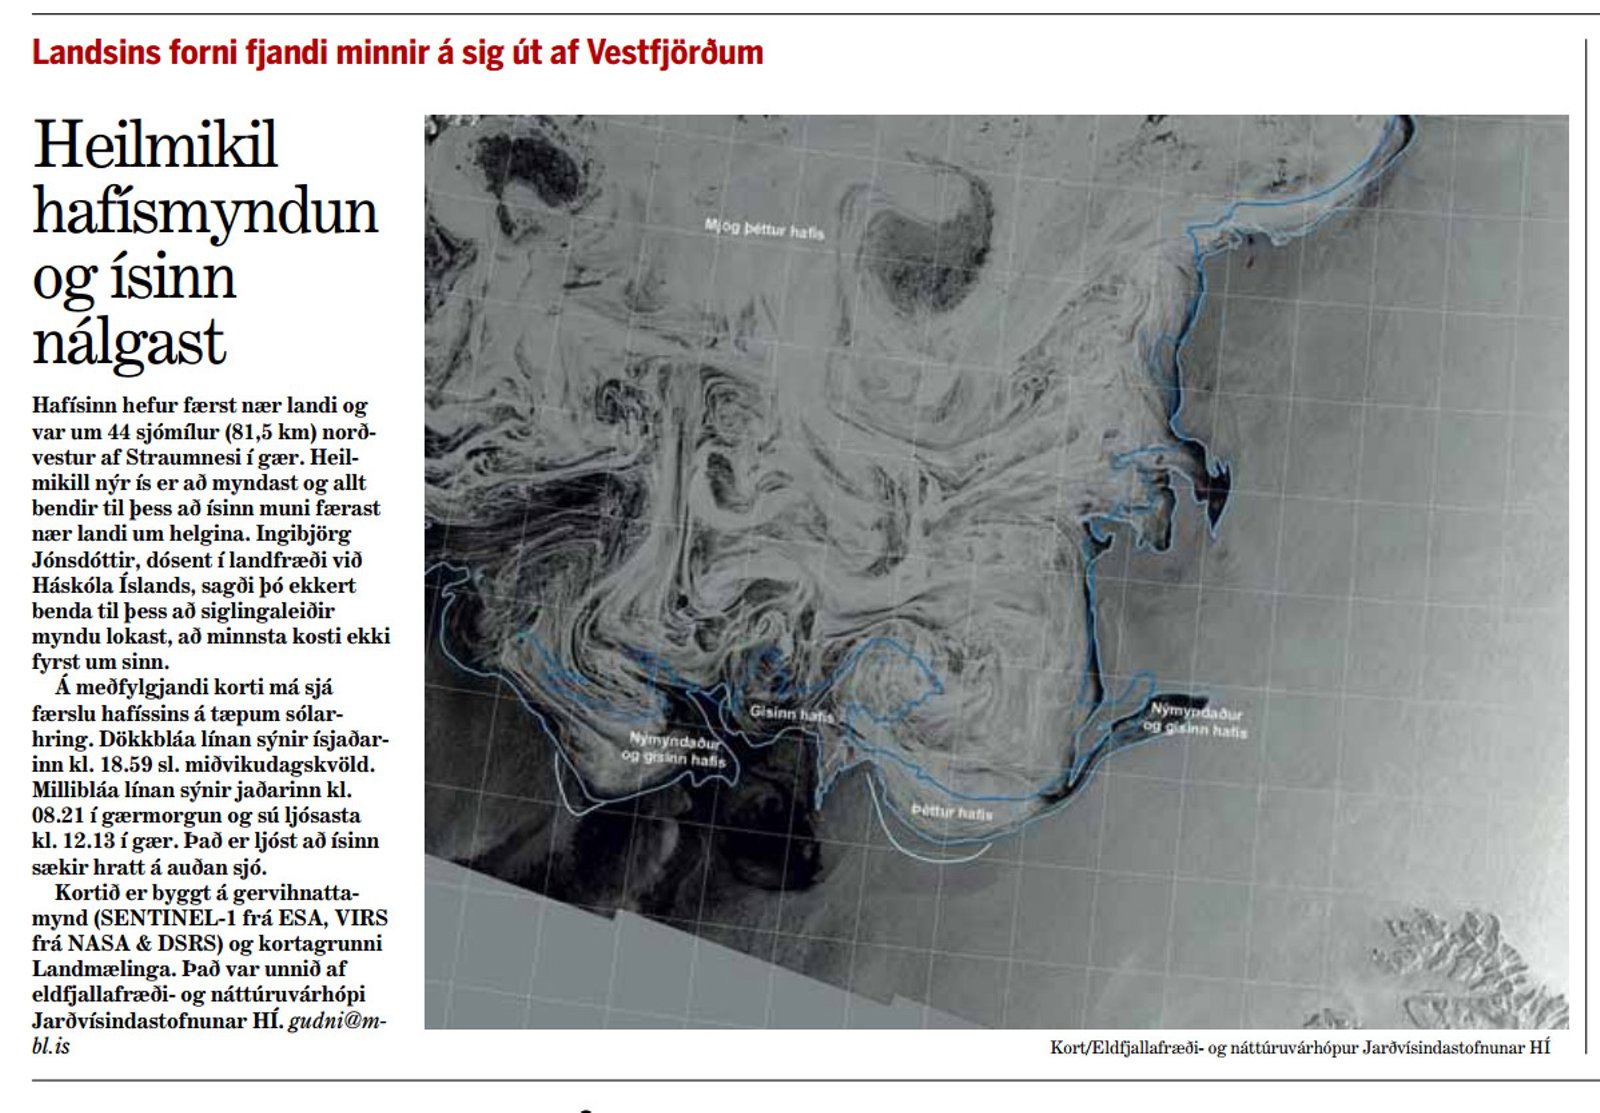
"Heilmikil hafķsmyndun og ķsinn nįlgast..."
Žaš er aušvitaš sjįlfsagt aš fylgjast meš landsins forna fjarna.
Enn sem komiš er heldur hann sig fjarri, en hver veit hvernig stašan veršur į nęstu įrum...?
Myndirnar eru frį Dönsku vešurstofunni DMI.
http://ocean.dmi.dk/arctic/old_icecover.uk.php
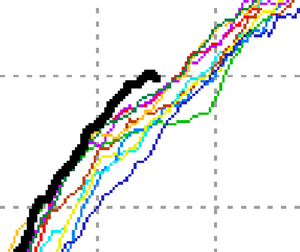
Klippt śr efstu myndinni
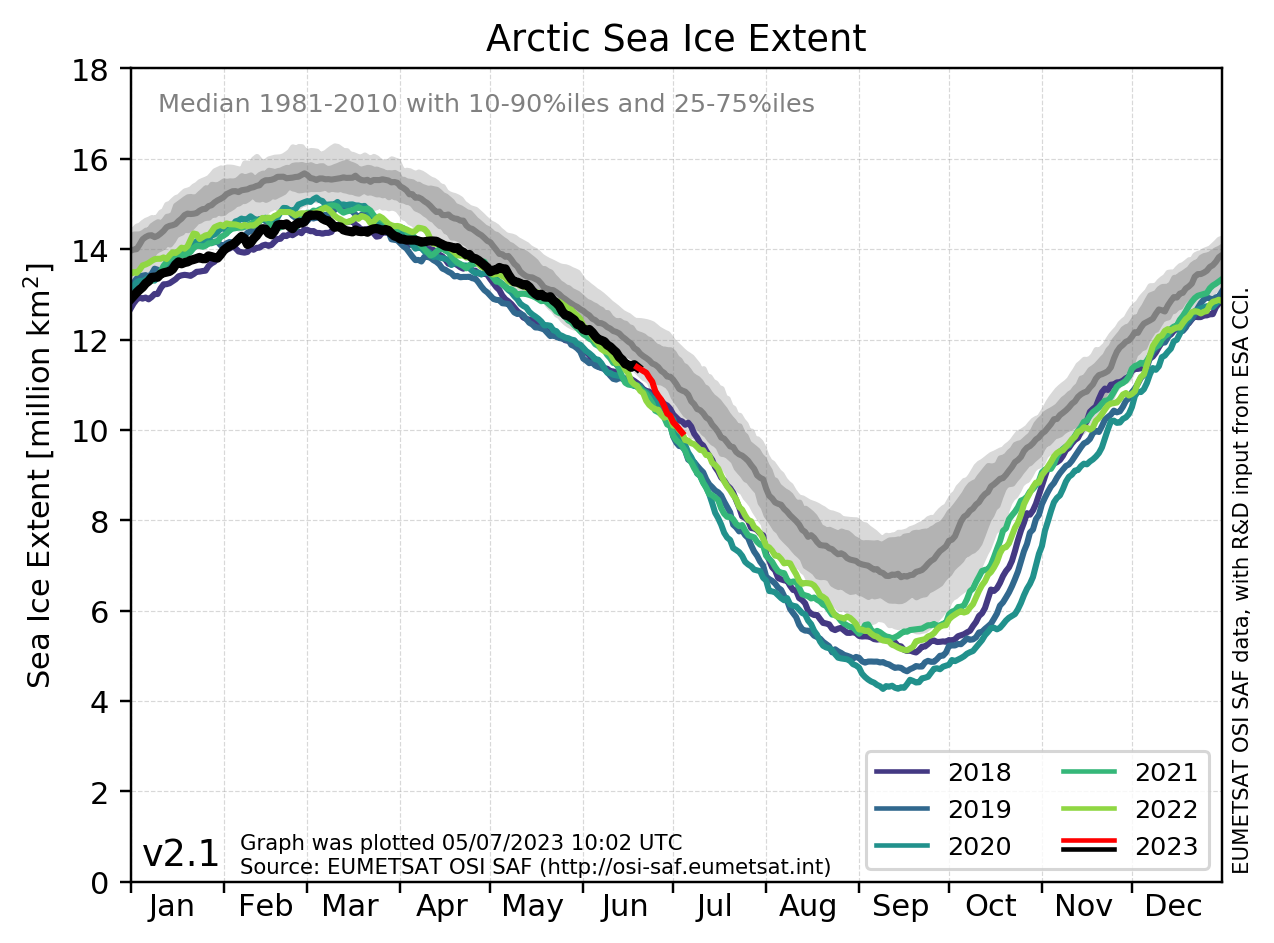
http://ocean.dmi.dk/arctic/icecover.uk.php
Uppfęrt 25. nóvember: Ķ dag birtist loksins nżr ferill į vef DMI eftir 12 daga hlé. Hann er dagsettur 24/11/15. Ferillinn sem var oršinn vikugamall žegar pistillinn var skrifašur 20. nóvember hefur žvķ veriš uppfęršur.
Sjį nżjustu śtgįfu beggja ferlanna meš žvķ aš smella į krękjurnar undir žeim.
Uppfęrt 22. nóvember: Myndin hér aš ofan hefur veriš óbreytt hjį DMI sķšan 13/11/15, sem bendir til einhverrar bilunar.
Frétt Morgunblašsins 20. nóvember 2015

|
Hafķsinn nįlgast |
| Tilkynna um óvišeigandi tengingu viš frétt | |
Umhverfismįl | Breytt 25.11.2015 kl. 15:19 | Slóš | Facebook
Föstudagur, 6. nóvember 2015
Jųrgen Peder Steffensen hjį Niels Bohr Institute: Hlżrra į Gręnlandi fyrir įržśsundi en ķ dag og ómögulegt aš dęma um hvort hlżindin nś séu nįttśruleg eša af mannavöldum...
Jųrgen Peder Steffensen jaršešlisfręšingur og lektor hjį Niels Bohr Institutet, Kųbenhavns Universitet fjallar ķ žessu stutta en fróšlega myndbandi um rannsóknir į borkjörnum frį Gręnlandsjökli. Dr. Jųrgen Peder Steffensen hefur mešal annars starfaš mikiš meš ķslenska ešlis- og jöklafręšingnum Dr. Sigfśsi Johnsen. Hann fręšir okkur mešal annars į žvķ aš fyrir įržśsundi hafi hitinn į Gręnlandi veriš 1,5 grįšum hęrri en ķ dag, og aš mjög erfitt sé aš sżna fram į hvort nśverndi hlżindi stafi af mannavöldum eša eigi sér nįttśrulegar orsakir.
- Fyrir įržśsundi var hitinn į Gręnlandi 1,5 grįšum hęrri en ķ dag. - Hann var ef til vill 2.5 C hęrri fyrir 4000 įrum. - Rannsóknir vķšar ķ heiminum styšja žessa mynd. - Mjög erfitt aš sżna fram į hvort nśverndi hlżindi stafi af mannavöldum eša eigi sér nįttśrulegar orsakir
|

Umhverfismįl | Breytt s.d. kl. 12:30 | Slóš | Facebook
Mįnudagur, 19. október 2015
Mögnuš ręša Dr. Patrick Moore stofnanda Greenpeace...
Dr. Patrick Moore umhverfisfręšingur, stofnandi Greenpeace, hélt ķ sķšustu viku magnašan fyrirlestur. Myndband er hér fyrir nešan, en prentaša śtgįfu mį lesa nešar į sķšunni eša meš žvķ aš smella hér. Patrick Moore ręšir hér uppvaxtarįr sķn og skólagöngu og žį tķma sem hann starfaši meš Greenpeace eftir aš hann tók žįtt ķ stofnun samtakanna, svo og hvers vegna hann yfirgaf samtökin. Sķšan fjallar hann um koltvķsżring jaršsögunni og bendir į żmsar jįkvęšar hlišar mįlsins, en koltvķsżringur er undirstaša alls lķfs į jöršinni. Žetta er einkar fróšlegt og vel žess virši aš hlusta. Óneitanlega umhugsunarveršur vinkill į mįliš.
(Sjį annaš myndband nešst į sķšunni). |
Hér er gömul vefsķša frį Greenpeace. The Founders of GreenpeacePatrick Moore er annar frį vinstri ķ efri röš į myndinni į žessari gömlu Greenpeace vefsķšu, sem er afrituš hér fyrir nešan.
|
Kjósi einhver aš lesa frekar en aš horfa, žį er fyrirlesturinn eša ręšan frį 14. október 2015 hér ķ heild sinni:
My Lords and Ladies, Ladies and Gentlemen. Thank you for the opportunity to set out my views on climate change. As I have stated publicly on many occasions, there is no definitive scientific proof, through real-world observation, that carbon dioxide is responsible for any of the slight warming of the global climate that has occurred during the past 300 years, since the peak of the Little Ice Age. If there were such a proof through testing and replication it would have been written down for all to see. The contention that human emissions are now the dominant influence on climate is simply a hypothesis, rather than a universally accepted scientific theory. It is therefore correct, indeed verging on compulsory in the scientific tradition, to be skeptical of those who express certainty that “the science is settled” and “the debate is over”. But there is certainty beyond any doubt that CO2 is the building block for all life on Earth and that without its presence in the global atmosphere at a sufficient concentration this would be a dead planet. Yet today our children and our publics are taught that CO2 is a toxic pollutant that will destroy life and bring civilization to its knees. Tonight I hope to turn this dangerous human-caused propaganda on its head. Tonight I will demonstrate that human emissions of CO2 have already saved life on our planet from a very untimely end. That in the absence of our emitting some of the carbon back into the atmosphere from whence it came in the first place, most or perhaps all life on Earth would begin to die less than two million years from today.
But first a bit of background. I was born and raised in the tiny floating village of Winter Harbour on the northwest tip of Vancouver Island, in the rainforest by the Pacific. There was no road to my village so for eight years myself and a few other children were taken by boat each day to a one-room schoolhouse in the nearby fishing village. I didn’t realize how lucky I was playing on the tide flats by the salmon-spawning streams in the rainforest, until I was sent off to boarding school in Vancouver where I excelled in science. I did my undergraduate studies at the University of British Columbia, gravitating to the life sciences – biology, biochemistry, genetics, and forestry – the environment and the industry my family has been in for more than 100 years. Then, before the word was known to the general public, I discovered the science of ecology, the science of how all living things are inter-related, and how we are related to them. At the height of the Cold War, the Vietnam War, the threat of all-out nuclear war and the newly emerging consciousness of the environment I was transformed into a radical environmental activist. While doing my PhD in ecology in 1971 I joined a group of activists who had begun to meet in the basement of the Unitarian Church, to plan a protest voyage against US hydrogen bomb testing in Alaska. We proved that a somewhat rag-tag looking group of activists could sail an old fishing boat across the north Pacific ocean and help change the course of history. We created a focal point for the media to report on public opposition to the tests. When that H-bomb exploded in November 1971, it was the last hydrogen bomb the United States ever detonated. Even though there were four more tests planned in the series, President Nixon canceled them due to the public opposition we had helped to create. That was the birth of Greenpeace. Flushed with victory, on our way home from Alaska we were made brothers of the Namgis Nation in their Big House at Alert Bay near my northern Vancouver Island home. For Greenpeace this began the tradition of the Warriors of the Rainbow, after a Cree Indian legend that predicted the coming together of all races and creeds to save the Earth from destruction. We named our ship the Rainbow Warrior and I spent the next fifteen years in the top committee of Greenpeace, on the front lines of the environmental movement as we evolved from that church basement into the world’s largest environmental activist organization. Next we took on French atmospheric nuclear testing in the South Pacific. They proved a bit more difficult than the US nuclear tests. It took years to eventually drive these tests underground at Mururoa Atoll in French Polynesia. In 1985, under direct orders from President Mitterrand, French commandos bombed and sank the Rainbow Warrior in Auckland Harbour, killing our photographer. Those protests continued until long after I left Greenpeace. It wasn’t until the mid-1990s that nuclear testing finally ended in the South Pacific, and it most other parts of the world as well. Going back to 1975, Greenpeace set out to save the whales from extinction at the hands of huge factory whaling fleets. We confronted the Soviet factory whaling fleet in the North Pacific, putting ourselves in front of their harpoons in our little rubber boats to protect the fleeing whales. This was broadcast on television news around the world, bringing the Save the Whales movement into everyone’s living rooms for the first time. After four years of voyages, in 1979 factory whaling was finally banned in the North Pacific, and by 1981 in all the world’s oceans. In 1978 I sat on a baby seal off the East Coast of Canada to protect it from the hunter’s club. I was arrested and hauled off to jail, the seal was clubbed and skinned, but a photo of me being arrested while sitting on the baby seal appeared in more than 3000 newspapers around the world the next morning. We won the hearts and minds of millions of people who saw the baby seal slaughter as outdated, cruel, and unnecessary. Why then did I leave Greenpeace after 15 years in the leadership? When Greenpeace began we had a strong humanitarian orientation, to save civilization from destruction by all-out nuclear war. Over the years the “peace” in Greenpeace was gradually lost and my organization, along with much of the environmental movement, drifted into a belief that humans are the enemies of the earth. I believe in a humanitarian environmentalism because we are part of nature, not separate from it. The first principle of ecology is that we are all part of the same ecosystem, as Barbara Ward put it, “One human family on spaceship Earth”, and to preach otherwise teaches that the world would be better off without us. As we shall see later in the presentation there is very good reason to see humans as essential to the survival of life on this planet. In the mid 1980s I found myself the only director of Greenpeace International with a formal education in science. My fellow directors proposed a campaign to “ban chlorine worldwide”, naming it “The Devil’s Element”. I pointed out that chlorine is one of the elements in the Periodic Table, one of the building blocks of the Universe and the 11th most common element in the Earth’s crust. I argued the fact that chlorine is the most important element for public health and medicine. Adding chlorine to drinking water was the biggest advance in the history of public health and the majority of our synthetic medicines are based on chlorine chemistry. This fell on deaf ears, and for me this was the final straw. I had to leave. When I left Greenpeace I vowed to develop an environmental policy that was based on science and logic rather than sensationalism, misinformation, anti-humanism and fear. In a classic example, a recent protest led by Greenpeace in the Philippines used the skull and crossbones to associate Golden Rice with death, when in fact Golden Rice has the potential to help save 2 million children from death due to vitamin A deficiency every year.
The Keeling curve of CO2 concentration in the Earth’s atmosphere since 1959 is the supposed smoking gun of catastrophic climate change. We presume CO2 was at 280 ppm at the beginning of the Industrial Revolution, before human activity could have caused a significant impact. I accept that most of the rise from 280 to 400 ppm is caused by human CO2 emissions with the possibility that some of it is due to outgassing from warming of the oceans. NASA tells us that “Carbon Dioxide Controls Earth’s Temperature” in child-like denial of the many other factors involved in climate change. This is reminiscent of NASA’s contention that there might be life on Mars. Decades after it was demonstrated that there was no life on Mars, NASA continues to use it as a hook to raise public funding for more expeditions to the Red Planet. The promulgation of fear of Climate Change now serves the same purpose. As Bob Dylan prophetically pointed out, “Money doesn’t talk, it swears”, even in one of the most admired science organizations in the world. On the political front the leaders of the G7 plan to “end extreme poverty and hunger” by phasing out 85% of the world’s energy supply including 98% of the energy used to transport people and goods, including food. The Emperors of the world appear clothed in the photo taken at the close of the meeting but it was obviously Photo-shopped. They should be required to stand naked for making such a foolish statement. The world’s top climate body, the Intergovernmental Panel on Climate change, is hopelessly conflicted by its makeup and it mandate. The Panel is composed solely of the World Meteorological Organization, weather forecasters, and the United Nations Environment Program, environmentalists. Both these organizations are focused primarily on short-term timescales, days to maybe a century or two. But the most significant conflict is with the Panel’s mandate from the United Nations. They are required only to focus on “a change of climate which is attributed directly or indirectly to human activity that alters the composition of the atmosphere, and which is in addition to natural climate variability.”ā€ØSo if the IPCC found that climate change was not being affected by human alteration of the atmosphere or that it is not “dangerous” there would be no need for them to exist. They are virtually mandated to find on the side of apocalypse. Scientific certainty, political pandering, a hopelessly conflicted IPCC, and now the Pope, spiritual leader of the Catholic Church, in a bold move to reinforce the concept of original sin, says the Earth looks like “an immense pile of filth” and we must go back to pre-industrial bliss, or is that squalor? And then there is the actual immense pile of filth fed to us more than three times daily by the green-media nexus, a seething cauldron of imminent doom, like we are already condemned to Damnation in Hell and there is little chance of Redemption. I fear for the end of the Enlightenment. I fear an intellectual Gulag with Greenpeace as my prison guards.
Let’s begin with our knowledge of the long-term history of the Earth’s temperature and of CO2 in the Earth’s atmosphere. Our best inference from various proxies back indicate that CO2 was higher for the first 4 billion years of Earth’s history than it has been since the Cambrian Period until today. I will focus on the past 540 million years since modern life forms evolved. It is glaringly obvious that temperature and CO2 are in an inverse correlation at least as often as they are in any semblance of correlation. Two clear examples of reverse correlation occurred 150 million years and 50 million years ago. At the end of the Jurassic temperature fell dramatically while CO2 spiked. During the Eocene Thermal Maximum, temperature was likely higher than any time in the past 550 million years while CO2 had been on a downward track for 100 million years. This evidence alone sufficient to warrant deep speculation of any claimed lock-step causal relationship between CO2 and temperature. The Devonian Period beginning 400 million years ago marked the culmination of the invasion of life onto the land. Plants evolved to produce lignin, which in combination with cellulose, created wood which in turn for the first time allowed plants to grow tall, in competition with each other for sunlight. As vast forests spread across the land living biomass increased by orders of magnitude, pulling down carbon as CO2 from the atmosphere to make wood. Lignin is very difficult to break down and no decomposer species possessed the enzymes to digest it. Trees died atop one another until they were 100 metres or more in depth. This was the making of the great coal beds around the world as this huge store of sequestered carbon continued to build for 90 million years. Then, fortunately for the future of life, white rot fungi evolved to produce the enzymes that can digest lignin and coincident with that the coal-making era came to an end. There was no guarantee that fungi or any other decomposer species would develop the complex of enzymes required to digest lignin. If they had not, CO2, which had already been drawn down for the first time in Earth’s history to levels similar to todays, would have continued to decline as trees continued to grow and die. That is until CO2 approached the threshold of 150 ppm below which plants begin first to starve, then stop growing altogether, and then die. Not just woody plants but all plants. This would bring about the extinction of most, if not all, terrestrial species, as animals, insects, and other invertebrates starved for lack of food. And that would be that. The human species would never have existed. This was only the first time that there was a distinct possibility that life would come close to extinguishing itself, due to a shortage of CO2, which is essential for life on Earth. A well-documented record of global temperature over the past 65 million years shows that we have been in a major cooling period since the Eocene Thermal Maximum 50 million years ago. The Earth was an average 16C warmer then, with most of the increased warmth at the higher latitudes. The entire planet, including the Arctic and Antarctica were ice-free and the land there was covered in forest. The ancestors of every species on Earth today survived through what may have been the warmest time in the history of life. It makes one wonder about dire predictions that even a 2C rise in temperature from pre-industrial times would cause mass extinctions and the destruction of civilization. Glaciers began to form in Antarctica 30 million years ago and in the northern hemisphere 3 million years ago. Today, even in this interglacial period of the Pleistocene Ice Age, we are experiencing one of the coldest climates in the Earth’s history. Coming closer to the present we have learned from Antarctic ice cores that for the past 800,000 years there have been regular periods of major glaciation followed by interglacial periods in 100,000 year-cycles. These cycles coincide with the Milankovitch cycles that are tied to the eccentricity of the Earth’s orbit and its axial tilt. It is highly plausible that these cycles are related to solar intensity and the seasonal distribution of solar heat on the Earth’s surface. There is a strong correlation between temperature and the level of atmospheric CO2 during these successive glaciations, indicating a possible cause-effect relationship between the two. CO2 lags temperature by an average of 800 years during the most recent 400,000-year period, indicating that temperature is the cause, as the cause never comes after the effect. Looking at the past 50,000 years of temperature and CO2 we can see that changes in CO2 follow changes in temperature. This is as one could expect, as the Milankovitch cycles are far more likely to cause a change in temperature than a change in CO2. And a change in the temperature is far more likely to cause a change in CO2 due to outgassing of CO2 from the oceans during warmer times and an ingassing (absorption) of CO2 during colder periods. Yet climate alarmists persist in insisting that CO2 is causing the change in temperature, despite the illogical nature of that assertion.
It is sobering to consider the magnitude of climate change during the past 20,000 years, since the peak of the last major glaciation. At that time there were 3.3 kilometres of ice on top of what is today the city of Montreal, a city of more than 3 million people. 95% of Canada was covered in a sheet of ice. Even as far south as Chicago there was nearly a kilometre of ice. If the Milankovitch cycle continues to prevail, and there is little reason aside from our CO2 emissions to think otherwise, this will happen gradually again during the next 80,000 years. Will our CO2 emissions stave off another glaciation as James Lovelock has suggested? There doesn’t seem to be much hope of that so far, as despite 1/3 of all our CO2 emissions being released during the past 18 years the UK Met Office contends there has been no statistically significant warming during this century. At the height of the last glaciation the sea level was about 120 metres lower than it is today. By 7,000 years ago all the low-altitude, mid-latitude glaciers had melted. There is no consensus about the variation in sea level since then although many scientists have concluded that the sea level was higher than today during the Holocene Thermal optimum from 9,000 to 5,000 years ago when the Sahara was green. The sea level may also have been higher than today during the Medieval Warm Period. Hundred of islands near the Equator in Papua, Indonesia, have been undercut by the sea in a manner that gives credence to the hypothesis that there has been little net change in sea level in the past thousands of years. It takes a long time for so much erosion to occur from gentle wave action in a tropical sea. Coming back to the relationship between temperature and CO2 in the modern era we can see that temperature has risen at a steady slow rate in Central England since 1700 while human CO2 emissions were not relevant until 1850 and then began an exponential rise after 1950. This is not indicative of a direct causal relationship between the two. After freezing over regularly during the Little Ice Age the River Thames froze for the last time in 1814, as the Earth moved into what might be called the Modern Warm Period.
The IPCC states it is “extremely likely” that human emissions have been the dominant cause of global warming “since the mid-20th century”, that is since 1950. They claim that “extremely” means 95% certain, even though the number 95 was simply plucked from the air like an act of magic. And “likely” is not a scientific word but rather indicative of a judgment, another word for an opinion. There was a 30-year period of warming from 1910-1940, then a cooling from 1940 to 1970, just as CO2 emissions began to rise exponentially, and then a 30-year warming from 1970-2000 that was very similar in duration and temperature rise to the rise from 1910-1940. One may then ask “what caused the increase in temperature from 1910-1940 if it was not human emissions? And if it was natural factors how do we know that the same natural factors were not responsible for the rise between 1970-2000.” You don’t need to go back millions of years to find the logical fallacy in the IPCC’s certainty that we are the villains in the piece. Water is by far the most important greenhouse gas, and is the only molecule that is present in the atmosphere in all three states, gas, liquid, and solid. As a gas, water vapour is a greenhouse gas, but as a liquid and solid it is not. As a liquid water forms clouds, which send solar radiation back into space during the day and hold heat in at night. There is no possibility that computer models can predict the net effect of atmospheric water in a higher CO2 atmosphere. Yet warmists postulate that higher CO2 will result in positive feedback from water, thus magnifying the effect of CO2 alone by 2-3 times. Other scientists believe that water may have a neutral or negative feedback on CO2. The observational evidence from the early years of this century tends to reinforce the latter hypothesis.
How many politicians or members of the media or the public are aware of this statement about climate change from the IPCC in 2007? “we should recognise that we are dealing with a coupled nonlinear chaotic system, and therefore that the long-term prediction of future climate states is not possible.” There is a graph showing that the climate models have grossly exaggerated the rate of warming that confirms the IPCC statement. The only trends the computer models seem able to predict accurately are ones that have already occurred.
Coming to the core of my presentation, CO2 is the currency of life and the most important building block for all life on Earth. All life is carbon-based, including our own. Surely the carbon cycle and its central role in the creation of life should be taught to our children rather than the demonization of CO2, that “carbon” is a “pollutant” that threatens the continuation of life. We know for a fact that CO2 is essential for life and that it must be at a certain level in the atmosphere for the survival of plants, which are the primary food for all the other species alive today. Should we not encourage our citizens, students, teachers, politicians, scientists, and other leaders to celebrate CO2 as the giver of life that it is? It is a proven fact that plants, including trees and all our food crops, are capable of growing much faster at higher levels of CO2 than present in the atmosphere today. Even at the today’s concentration of 400 ppm plants are relatively starved for nutrition. The optimum level of CO2 for plant growth is about 5 times higher, 2000 ppm, yet the alarmists warn it is already too high. They must be challenged every day by every person who knows the truth in this matter. CO2 is the giver of life and we should celebrate CO2 rather than denigrate it as is the fashion today. We are witnessing the “Greening of the Earth” as higher levels of CO2, due to human emissions from the use of fossil fuels, promote increased growth of plants around the world. This has been confirmed by scientists with CSIRO in Australia, in Germany, and in North America. Only half of the CO2 we are emitting from the use of fossil fuels is showing up in the atmosphere. The balance is going somewhere else and the best science says most of it is going into an increase in global plant biomass. And what could be wrong with that, as forests and agricultural crops become more productive? All the CO2 in the atmosphere has been created by outgassing from the Earth’s core during massive volcanic eruptions. This was much more prevalent in the early history of the Earth when the core was hotter than it is today. During the past 150 million years there has not been enough addition of CO2 to the atmosphere to offset the gradual losses due to burial in sediments.
Let’s look at where all the carbon is in the world, and how it is moving around. Today, at just over 400 ppm CO2 there are 850 billion tons of CO2 in the atmosphere. By comparison, when modern life-forms evolved over 500 million years ago there was nearly 15,000 billion tons of CO2 in the atmosphere, 17 times today’s level. Plants and soils combined contain more than 2,000 billion tons of carbon, more that twice as much as the entire global atmosphere. The oceans contain 38,000 billion tons of dissolved CO2, 45 times as much as in the atmosphere. Fossil fuels, which were made from plants that pulled CO2 from the atmosphere account for 5,000 – 10,000 billion tons of carbon, 6 – 12 times as much carbon as is in the atmosphere. But the truly stunning number is the amount of carbon that has been sequestered from the atmosphere and turned into carbonaceous rocks. 100,000,000 billion tons, that’s one quadrillion tons of carbon, have been turned into stone by marine species that learned to make armour-plating for themselves by combining calcium and carbon into calcium carbonate. Limestone, chalk, and marble are all of life origin and amount to 99.9% of all the carbon ever present in the global atmosphere. The white cliffs of Dover are made of the calcium carbonate skeletons of coccolithophores, tiny marine phytoplankton. The vast majority of the carbon dioxide that originated in the atmosphere has been sequestered and stored quite permanently in carbonaceous rocks where it cannot be used as food by plants. Beginning 540 million years ago at the beginning of the Cambrian Period many marine species of invertebrates evolved the ability to control calcification and to build armour plating to protect their soft bodies. Shellfish such as clams and snails, corals, coccolithofores (phytoplankton) and foraminifera (zooplankton) began to combine carbon dioxide with calcium and thus to remove carbon from the life cycle as the shells sank into sediments; 100,000,000 billion tons of carbonaceous sediment. It is ironic that life itself, by devising a protective suit of armour, determined its own eventual demise by continuously removing CO2 from the atmosphere. This is carbon sequestration and storage writ large. These are the carbonaceous sediments that form the shale deposits from which we are fracking gas and oil today. And I add my support to those who say, “OK UK, get fracking”. The past 150 million years has seen a steady drawing down of CO2 from the atmosphere. There are many components to this but what matters is the net effect, a removal on average of 37,000 tons of carbon from the atmosphere every year for 150 million years. The amount of CO2 in the atmosphere was reduced by about 90% during this period. This means that volcanic emissions of CO2 have been outweighed by the loss of carbon to calcium carbonate sediments on a multi-million year basis. If this trend continues CO2 will inevitably fall to levels that threaten the survival of plants, which require a minimum of 150 ppm to survive. If plants die all the animals, insects, and other invertebrates that depend on plants for their survival will also die.
How long will it be at the present level of CO2 depletion until most or all of life on Earth is threatened with extinction by lack of CO2 in the atmosphere? During this Pleistocene Ice Age, CO2 tends to reach a minimum level when the successive glaciations reach their peak. During the last glaciation, which peaked 18,000 years ago, CO2 bottomed out at 180 ppm, extremely likely the lowest level CO2 has been in the history of the Earth. This is only 30 ppm above the level that plants begin to die. Paleontological research has demonstrated that even at 180 ppm there was a severe restriction of growth as plants began to starve. With the onset of the warmer interglacial period CO2 rebounded to 280 ppm. But even today, with human emissions causing CO2 to reach 400 ppm plants are still restricted in their growth rate, which would be much higher if CO2 were at 1000-2000 ppm. Here is the shocking news. If humans had not begun to unlock some of the carbon stored as fossil fuels, all of which had been in the atmosphere as CO2 before sequestration by plants and animals, life on Earth would have soon been starved of this essential nutrient and would begin to die. Given the present trends of glaciations and interglacial periods this would likely have occurred less than 2 million years from today, a blink in nature’s eye, 0.05% of the 3.5 billion-year history of life. No other species could have accomplished the task of putting some of the carbon back into the atmosphere that was taken out and locked in the Earth’s crust by plants and animals over the millennia. This is why I honour James Lovelock in my lecture this evening. Jim was for many years of the belief that humans are the one-and-only rogue species on Gaia, destined to cause catastrophic global warming. I enjoy the Gaia hypothesis but I am not religious about it and for me this was too much like original sin. It was as if humans were the only evil species on the Earth.
But James Lovelock has seen the light and realized that humans may be part of Gaia’s plan, and he has good reason to do so. And I honour him because it takes courage to change your mind after investing so much of your reputation on the opposite opinion. Rather than seeing humans as the enemies of Gaia, Lovelock now sees that we may be working with Gaia to “stave of another ice age”, or major glaciation. This is much more plausible than the climate doom-and gloom scenario because our release of CO2 back into the atmosphere has definitely reversed the steady downward slide of this essential food for life, and hopefully may reduce the chance that the climate will slide into another period of major glaciation. We can be certain that higher levels of CO2 will result in increased plant growth and biomass. We really don’t know whether or not higher levels of CO2 will prevent or reduce the eventual slide into another major glaciation. Personally I am not hopeful for this because the long-term history just doesn’t support a strong correlation between CO2 and temperature.
It does boggle the mind in the face of our knowledge that the level of CO2 has been steadily falling that human CO2 emissions are not universally acclaimed as a miracle of salvation. From direct observation we already know that the extreme predictions of CO2’s impact on global temperature are highly unlikely given that about one-third of all our CO2 emissions have been discharged during the past 18 years and there has been no statistically significant warming. And even if there were some additional warming that would surely be preferable to the extermination of all or most species on the planet. You heard it here. “Human emissions of carbon dioxide have saved life on Earth from inevitable starvation and extinction due to lack of CO2”. To use the analogy of the Atomic Clock, if the Earth were 24 hours old we were at 38 seconds to midnight when we reversed the trend towards the End Times. If that isn’t good news I don’t know what is. You don’t get to stave off Armageddon every day.
I issue a challenge to anyone to provide a compelling argument that counters my analysis of the historical record and the prediction of CO2 starvation based on the 150 million year trend. Ad hominem arguments about “deniers” need not apply. I submit that much of society has been collectively misled into believing that global CO2 and temperature are too high when the opposite is true for both. Does anyone deny that below 150 ppm CO2 that plants will die? Does anyone deny that the Earth has been in a 50 million-year cooling period and that this Pleistocene Ice Age is one of the coldest periods in the history of the planet?
If we assume human emissions have to date added some 200 billion tons of CO2 to the atmosphere, even if we ceased using fossil fuels today we have already bought another 5 million years for life on earth. But we will not stop using fossil fuels to power our civilization so it is likely that we can forestall plant starvation for lack of CO2 by at least 65 million years. Even when the fossil fuels have become scarce we have the quadrillion tons of carbon in carbonaceous rocks, which we can transform into lime and CO2 for the manufacture of cement. And we already know how to do that with solar energy or nuclear energy. This alone, regardless of fossil fuel consumption, will more than offset the loss of CO2 due to calcium carbonate burial in marine sediments. Without a doubt the human species has made it possible to prolong the survival of life on Earth for more than 100 million years. We are not the enemy of nature but its salvation.
As a postscript I would like to make a few comments about the other side of the alleged dangerous climate change coin, our energy policy, in particular the much maligned fossil fuels; coal, oil, and natural gas. Depending how it’s tallied, fossil fuels account for between 85-88% of global energy consumption and more than 95% of energy for the transport of people and goods, including our food. Earlier this year the leaders of the G7 countries agreed that fossil fuels should be phased out by 2100, a most bizarre development to say the least. Of course no intelligent person really believes this will happen but it is a testament to the power of the elites that have converged around the catastrophic human-caused climate change that so many alleged world leaders must participate in the charade. How might we convince them to celebrate CO2 rather than to denigrate it? A lot of nasty things are said about fossil fuels even though they are largely responsible for our longevity, our prosperity, and our comfortable lifestyles. Hydrocarbons, the energy components of fossil fuels, are 100% organic, as in organic chemistry. They were produced by solar energy in ancient seas and forests. When they are burned for energy the main products are water and CO2, the two most essential foods for life. And fossil fuels are by far the largest storage battery of direct solar energy on Earth. Nothing else comes close except nuclear fuel, which is also solar in the sense that it was produced in dying stars.
Today, Greenpeace protests Russian and American oil rigs with 3000 HP diesel-powered ships and uses 200 HP outboard motors to board the rigs and hang anti-oil plastic banners made with fossil fuels. Then they issue a media release telling us we must “end our addiction to oil”. I wouldn’t mind so much if Greenpeace rode bicycles to their sailing ships and rowed their little boats into the rigs to hang organic cotton banners. We didn’t have an H-bomb on board the boat that sailed on the first Greenpeace campaign against nuclear testing.
Some of the world’s oil comes from my native country in the Canadian oil sands of northern Alberta. I had never worked with fossil fuel interests until I became incensed with the lies being spread about my country’s oil production in the capitals of our allies around the world. I visited the oil sands operations to find out for myself what was happening there. It is true it’s not a pretty sight when the land is stripped bare to get at the sand so the oil can be removed from it. Canada is actually cleaning up the biggest natural oil spill in history, and making a profit from it. The oil was brought to the surface when the Rocky Mountains were thrust up by the colliding Pacific Plate. When the sand is returned back to the land 99% of the so-called “toxic oil” has been removed from it. Anti-oil activists say the oil-sands operations are destroying the boreal forest of Canada. Canada’s boreal forest accounts for 10% of all the world’s forests and the oil-sands area is like a pimple on an elephant by comparison. By law, every square inch of land disturbed by oil-sands extraction must be returned to native boreal forest. When will cities like London, Brussels, and New York that have laid waste to the natural environment be returned to their native ecosystems? The art and science of ecological restoration, or reclamation as it is called in the mining industry, is a well-established practice. The land is re-contoured, the original soil is put back, and native species of plants and trees are established. It is possible, by creating depressions where the land was flat, to increase biodiversity by making ponds and lakes where wetland plants, insects, and waterfowl can become established in the reclaimed landscape. The tailings ponds where the cleaned sand is returned look ugly for a few years but are eventually reclaimed into grasslands. The Fort McKay First Nation is under contract to manage a herd of bison on a reclaimed tailings pond. Every tailings pond will be reclaimed in a similar manner when operations have been completed. As an ecologist and environmentalist for more than 45 years this is good enough for me. The land is disturbed for a blink of an eye in geological time and is then returned to a sustainable boreal forest ecosystem with cleaner sand. And as a bonus we get the fuel to power our weed-eaters, scooters, motorcycles, cars, trucks, buses, trains, and aircraft.
To conclude, carbon dioxide from burning fossil fuels is the stuff of life, the staff of life, the currency of life, indeed the backbone of life on Earth.
I am honoured to have been chosen to deliver your annual lecture. Thank you for listening to me this evening. I hope you have seen CO2 from a new perspective and will join with me to Celebrate CO2!
|
--- --- ---
Eftirmįli:
Myndband sem nefnist
Confessions of a Greenpeace Dropout
Dr Patrick Moore
Erindi flutt į rįšstefnu ICCC
International Conference on Climate Change
8. jślķ 2014
Umhverfismįl | Breytt 20.10.2015 kl. 08:24 | Slóš | Facebook
Sunnudagur, 23. įgśst 2015
Nóbelsveršlaunahafinn ķ ešlisfręši 1973 fjallaši um mįl mįlanna fyrir skömmu. - Athyglisvert...!
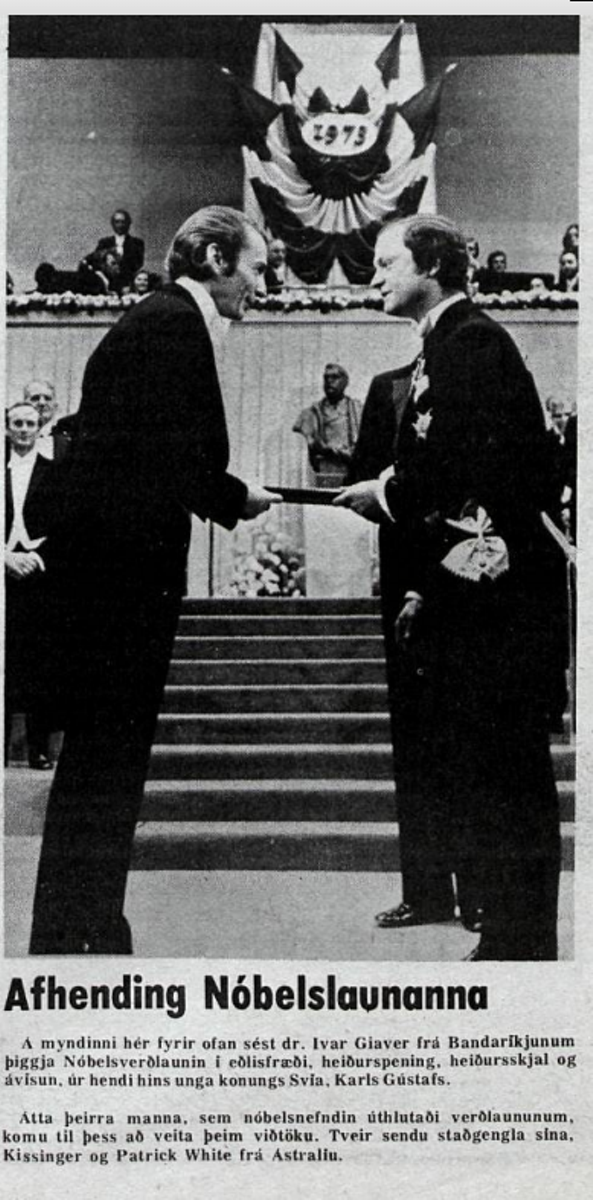
Noršmašurinn Ivar Gięver fékk nóbelsveršlaunin ķ ešlisfręši įriš 1973 vegna rannsókna ķ skammtafręši į hįlfleišurum og ofurleišni. Į samkomu nóbelsveršlaunahafa 1. jślķ sķšastlišinn hélt hann ręšu sem eftir var tekiš. Enginn ętti aš lįta žetta fram hjį sér fara og hlusta vel į noršmanninn Ivar Giaever. Hann talar mjög skżrt og śtskżrir mįls sitt žannig aš allir ęttu aš skilja vel. Hann er greinilega meš brjóstvitiš og fręšin į hreinu. Žessi heišursmašur er fęddur įriš 1929. Erindiš fjallar um mįl mįlanna, ž.e. hnatthlżnun, hękkun sjįvarboršs, óvešur og fleira ...
|
Vķsir 15. desember 1973
Vištal viš Ivar Giaever um lķfiš og tilveruna:
http://www.nobelprize.org/mediaplayer/index.php?id=713
http://www.nobelprize.org/mediaplayer/index.php?id=713
Interview with Professor Ivar Giaever by freelance journalist Marika Griehsel at the 54th meeting of Nobel Laureates in Lindau, Germany, June 2004. Professor Giaever talks about celebrating being awarded the Nobel Prize, his move from Norway to Canada and the USA (2:03), how he got the job at General Electrics despite low grades (4:39), the reasons why he became an entrepreneur (9:53), his thoughts about research (13:48) and also gives some advice to young students (15:45).
|
Umhverfismįl | Breytt s.d. kl. 11:46 | Slóš | Facebook
Mįnudagur, 17. įgśst 2015
Rżrnun jökla; kólnun eša hlżnun framundan...?
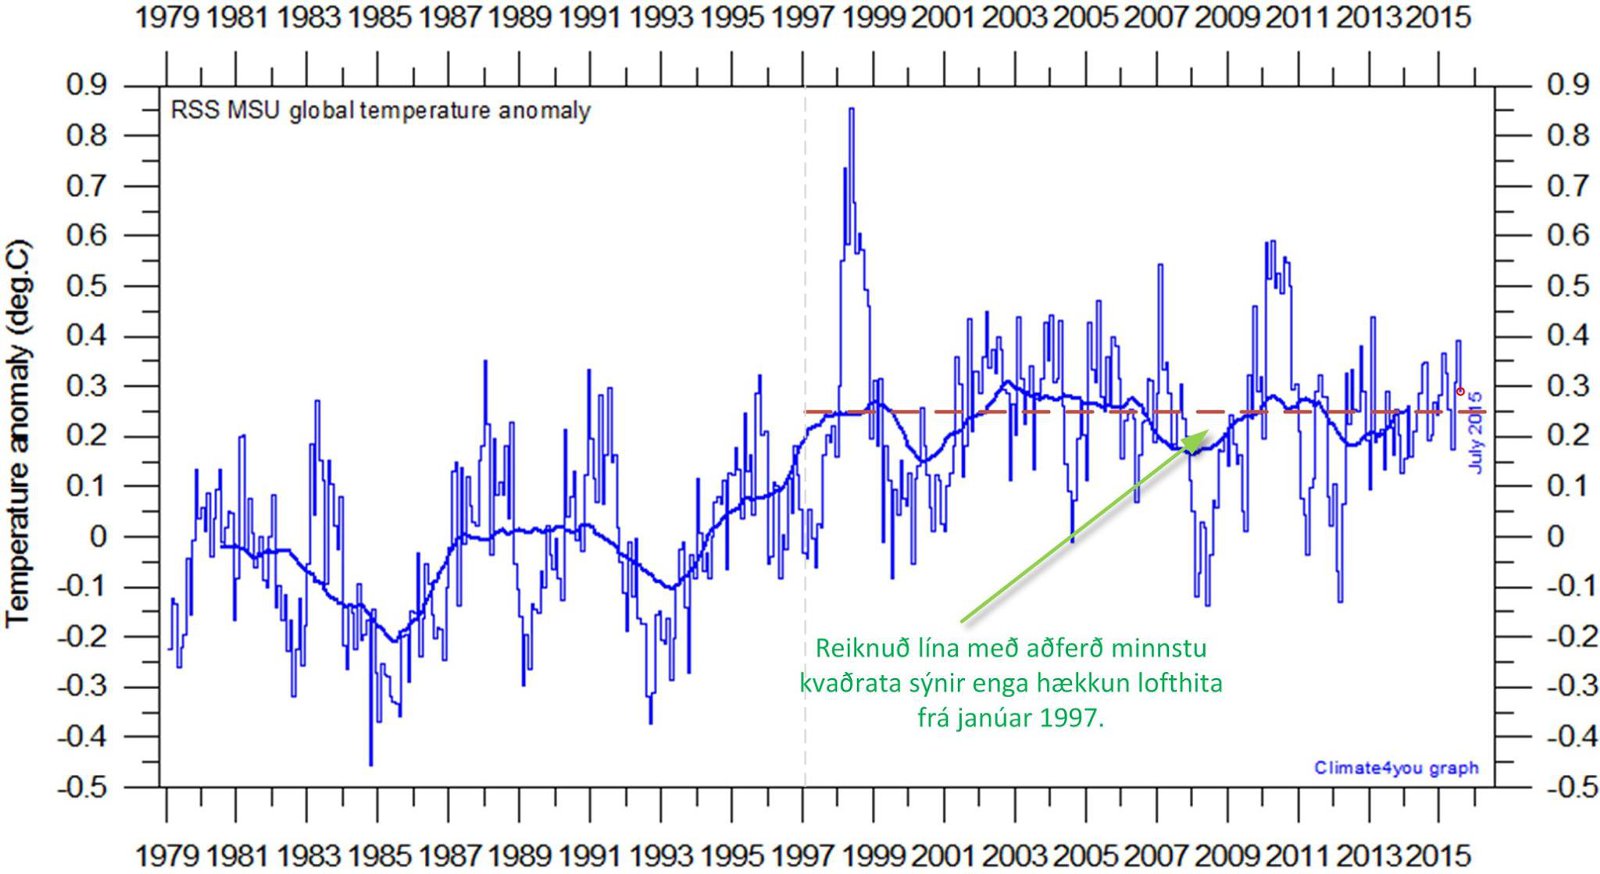
Stórt er spurt ķ fyrirsögn pistilsins og svariš er einfalt: Veit ekki. Žaš er žó įhugavert aš velta žessu ašeins fyrir sér, sérstaklega žar sem hitastig jaršar hefur stašiš meira og minna ķ staš ķ fjölda įra. Menn eru žó aš deila um hvort eitt įriš sé hlżrra eša kaldara en annaš, en žį er munurinn oftar en ekki tölfręšilega ómarktękur žvķ hann er innan męlióvissu. Hugsanlega gęti įriš ķ įr oršiš ķ hlżrra lagi meš hjįlp El Nińo sem er ķ gerjun nśna ķ Kyrrahafinu. Myndin efst į sķšunni: Samkvęmt męlingum meš gervihnöttum (RSS-MSU) hefur engin hękkun ķ lofthita jaršar oršiš sķšan ķ janśar 1997. Notuš er ašferš minnstu kvašrata til aš finna bestu ašhvarfslķnu (regression line). Smella į mynd til aš stękka og sjį betur. Ferillinn nęr til loka jślķ 2015. Hann er fenginn af vefsķšu Ole Humlum prófessors viš Oslóarhįskóla (www.climate4you.com), en sį er žessar lķnur ritar teiknaši inn į hann.
|

|
Rżrnun jökla endar mögulega ķ įr |
| Tilkynna um óvišeigandi tengingu viš frétt | |
Umhverfismįl | Breytt s.d. kl. 09:02 | Slóš | Facebook
Mišvikudagur, 8. aprķl 2015
Įhugavert vištal viš Freeman Dyson prófessor um loftslagsmįl, įhrif CO2, o.m.fl...
Freeman Dyson er einn virtasti vķsindamašur mešal nślifandi ešlis- og stęršfręšinga, prófessor emeritus viš Institute for Advanced Studies sem er tengt Princeton hįskóla. Hann er oršinn 91 įrs (2015) og hefur lifaš tķmana tvenna, m.a. starfaši hann um skeiš samtķmis Einstein viš hįskólann. Hann hefur hlotiš fjölda višurkenninga um ęvina. Žaš er varla ofsögum sagt aš hann er lifandi gošsögn ķ heimi vķsindanna. Nżlega birtist vištal (video) viš hann ķ vefśtgįfu The Vancouver Sun. Hann fjallar m.a. um hin jįkvęšu įhrif koltvķsżrings į gróšur jaršar, loftslagslķkönin, įhrif sólar, pólitķkina ķ vķsindum, o.fl. Žaš er vel žess virši aš hlusta į hvaš žessi hógvęri snillingur hefur aš segja ķ vištalinu viš Stuart McNish.
Ferilskrį Freeman Dyson:
Discover: The beautiful mind of Freeman Dyson: Wikipedia um Freeman Dyson:
Ritverk Freeman Dyson į Amazon.
Af vefsķšu Institute for Advanced Studies: The Institute is a private, independent academic institution located in Princeton, New Jersey. It was founded in 1930 by philanthropists Louis Bamberger and his sister Caroline Bamberger Fuld, and established through the vision of founding Director Abraham Flexner. Past Faculty have included Albert Einstein, who remained at the Institute until his death in 1955, and distinguished scientists and scholars such as Kurt Gödel, J. Robert Oppenheimer, Erwin Panofsky, Hetty Goldman, Homer A. Thompson, John von Neumann, George Kennan, Hermann Weyl, and Clifford Geertz." |
Umhverfismįl | Breytt 12.11.2017 kl. 18:12 | Slóš | Facebook | Athugasemdir (0)
Laugardagur, 7. mars 2015
"Mį bjóša žér snįkaolķu"...?
Mikiš er dįsamlegt aš koma heim śr vinnu ķ dagsbirtunni nśna ķ byrjun mars, og enn dįsamlegra veršur ķ vor og sumar žegar bjart veršur fram eftir öllu og hęgt aš njóta hins ķslenska sumars langt fram į kvöld. Žaš kemur svo sannarlega heilsunni ķ lag eftir langan vetur. Viš žurfum ekki aš efast um žaš aš fólki sem vill seinka klukkunni, eša jafnvel flżta henni, nś eša taka upp sumartķma til višbótar nśverandi tķma, eša žį bara seinka klukkunni yfir vetrarmįnušina, gengur gott eitt til. Sumir vilja aš sólin fylgi sem nęst gangi sólar og hįdegiš sé į sķnum staš, nema kannski į sumrin, en margir eru žó sannfęršir um aš nśverandi stilling klukkunnar sé best miš tilliti til żmissa sjónarmiša. Aušvitaš eru ekki allir sammįla og Ķslendingar kunna žaš allra žjóša best aš vera ósammįla.
Dr. Gunnlaugur Björnsson stjarnešlisfręšingur skrifaši ķ Morgunblašiš 25. febrśar:
"Mį bjóša žér snįkaolķu?
Žaš viršist mannskepnunni ešlilegt aš leita alltaf aušveldustu leiša śr öllum vandamįlum og helst aš geta skyggnst inn ķ framtķšina. Menn fara til spįkonu, kaupa sér kort hjį stjörnuspekingi og fleira. Į sama hįtt vilja menn geta keypt skyndilausnir į öllu žvķ sem žį hrjįir, remedķur hjį hómópötum, vöšvapillur og bętiefni alls konar ķ dósum, mörg gagnslaus og sum jafnvel skašleg. Žaš er meira aš segja reynt aš pranga inn į krabbameinssjśklinga vitagagnslausum efnum. Snįkaolķur nśtķmans taka į sig żmsar myndir. Undanfarin misseri hefur alveg sérstök śtgįfa af snįkaolķu veriš kynnt į Ķslandi. Hśn į aš lękna nįnast allt sem nöfnum tjįir aš nefna. Žaš žarf ekki aš taka hana inn og hśn kostar lķtiš sem ekkert. Žetta er slķk undraolķa aš hśn į ekki bara aš lękna nįnast alla sįlręna kvilla sem hrjį žjóšina, hśn į lķka aš draga verulega śr kostnaši viš heilbrigšiskerfiš. Ķsland er ķ allt ķ einu oršiš eins og villta vestriš var, žessi undraolķa er nefnilega hvergi bošin annars stašar. Ég į viš žį hugmynd aš meš žvķ einu aš breyta stillingu klukkunnar muni gešheilsa žjóšarinnar stórlagast, unglingar hętta aš vera syfjašir og žreyttir į morgnana og viš Ķslendingar almennt hętta aš drolla frameftir į kvöldin. Rökin sem fęrš eru fyrir žessu mį draga saman ķ eftirfarandi:
Bretar eru meš sķna klukku stillta eins nęrri sólargangi og kostur er. Žeir glķma viš sömu vandamįl tengd svefni og svefnleysi og viš. Unglingar eru jafn syfjašir žar og annars stašar ķ veröldinni og brottfall įlķka. Sama er uppi į teningnum ķ Danmörku žar sem klukkan er lķka stillt nęrri sólargangi. Svefnleysi og kvillar tengdir žvķ hafa ekkert meš stillingu klukkunnar aš gera.
Viš Ķslendingar höfum stundum um fįtt aš sżsla, sérstaklega ķ skammdeginu. Žį detta ķ okkur żmsar grillur sem stęrri žjóšir sżnast aš mestu vera lausar viš. Engum öšrum hefur dottiš ķ hug aš alhęfa svo stórkostlega sem fylgismenn žessarar undarlegu hugmyndar gera žegar žeir halda žvķ fram aš breytt stilling klukkunnar sé allra meina bót, virki eins og snįkaolķa villta vestursins. Žaš er alvarlegt og įbyrgšarhluti, sérstaklega af fólki innan heilbrigšiskerfisins, aš halda žvķ fram og lofa žvķ aš žessi eina ašgerš sé slķk töfralausn sem talaš er um".
(Höfundur er deildarstjóri Hįloftadeildar Raunvķsindastofnunar Hįskólans). --- --- --- Hvaš segir Vķsindavefurinn um mįliš? Getum viš seinkaš klukkunni į Ķslandi og fengiš žannig fleiri birtustundir yfir daginn? Ef viš töpum 131 til 190 birtustundum į įri viš žaš aš seinka klukkunni, hvaš er žį unniš ?
Jęja, breyting į stillingu klukkunnar er žvķ mišur engin alhliša töfralausn frekan en snįkaolķan...
|
Sunnudagur, 18. janśar 2015
Deilt um keisarans skegg: Skekkjureikningar og loftslagsmįlin...
Smįvegis um keisarans skegg: Žegar bloggarinn var ķ menntaskóla og sķšar hįskóla var įvallt lögš mikil įhersla į aš nemendur framkvęmdu skekkjumat og skekkjureikninga og geršu grein fyrir óvissumörkum. Žaš žarf aš taka tillit til nįkvęmni žeirra męlitękja sem notuš hafa veriš, og atriša eins og aflestrarskekkju o.fl. Mat į skekkjuvöldum getur veriš dįlķtiš flókiš stundum og žurfa menn aš vera gagnrżnir, heišarlegir og skilja hvaš žeir eru aš fįst viš. Gera žarf greinarmun į tilviljanakenndum skekkjum og kerfisbundnum. Nota žarf réttar višurkenndar ašferšir viš skekkjumat og śrvinnslu. Allt hefur žetta įhrif į gęši męligagnanna og nišurstöšur, og er naušsynlegt aš gera grein fyrir slķku žegar męligögn eru birt. Žvķ mišur viršist žaš žó vera oršin algjör undantekning. Ķ menntaskóla og hįskóla fengu menn ešlisfręšiskżrslurnar ķ hausinn aftur ef réttir skekkjumatsreikningar voru ekki framkvęmdir og nišurstöšur tślkašar samkvęmt žvķ. Žaš er naušsynlegt aš vita og setja fram óvissubiliš eša skekkjumörkin įsamt męligögnum. Žetta veršur alltaf aš gera žegar vķsindagögn eru birt, žvķ annars eru žau markleysa. Smį dęmi: Hugsum okkur tvęr fęrslur ķ gagnagrunninum fyrir hitafrįvik: Fyrra gildiš getur žį veriš einhvers stašar į bilinu 0,2° til 0,4° og seinna gildiš į bilinu 0,3° til 0,5° vegna óvissumarkanna.
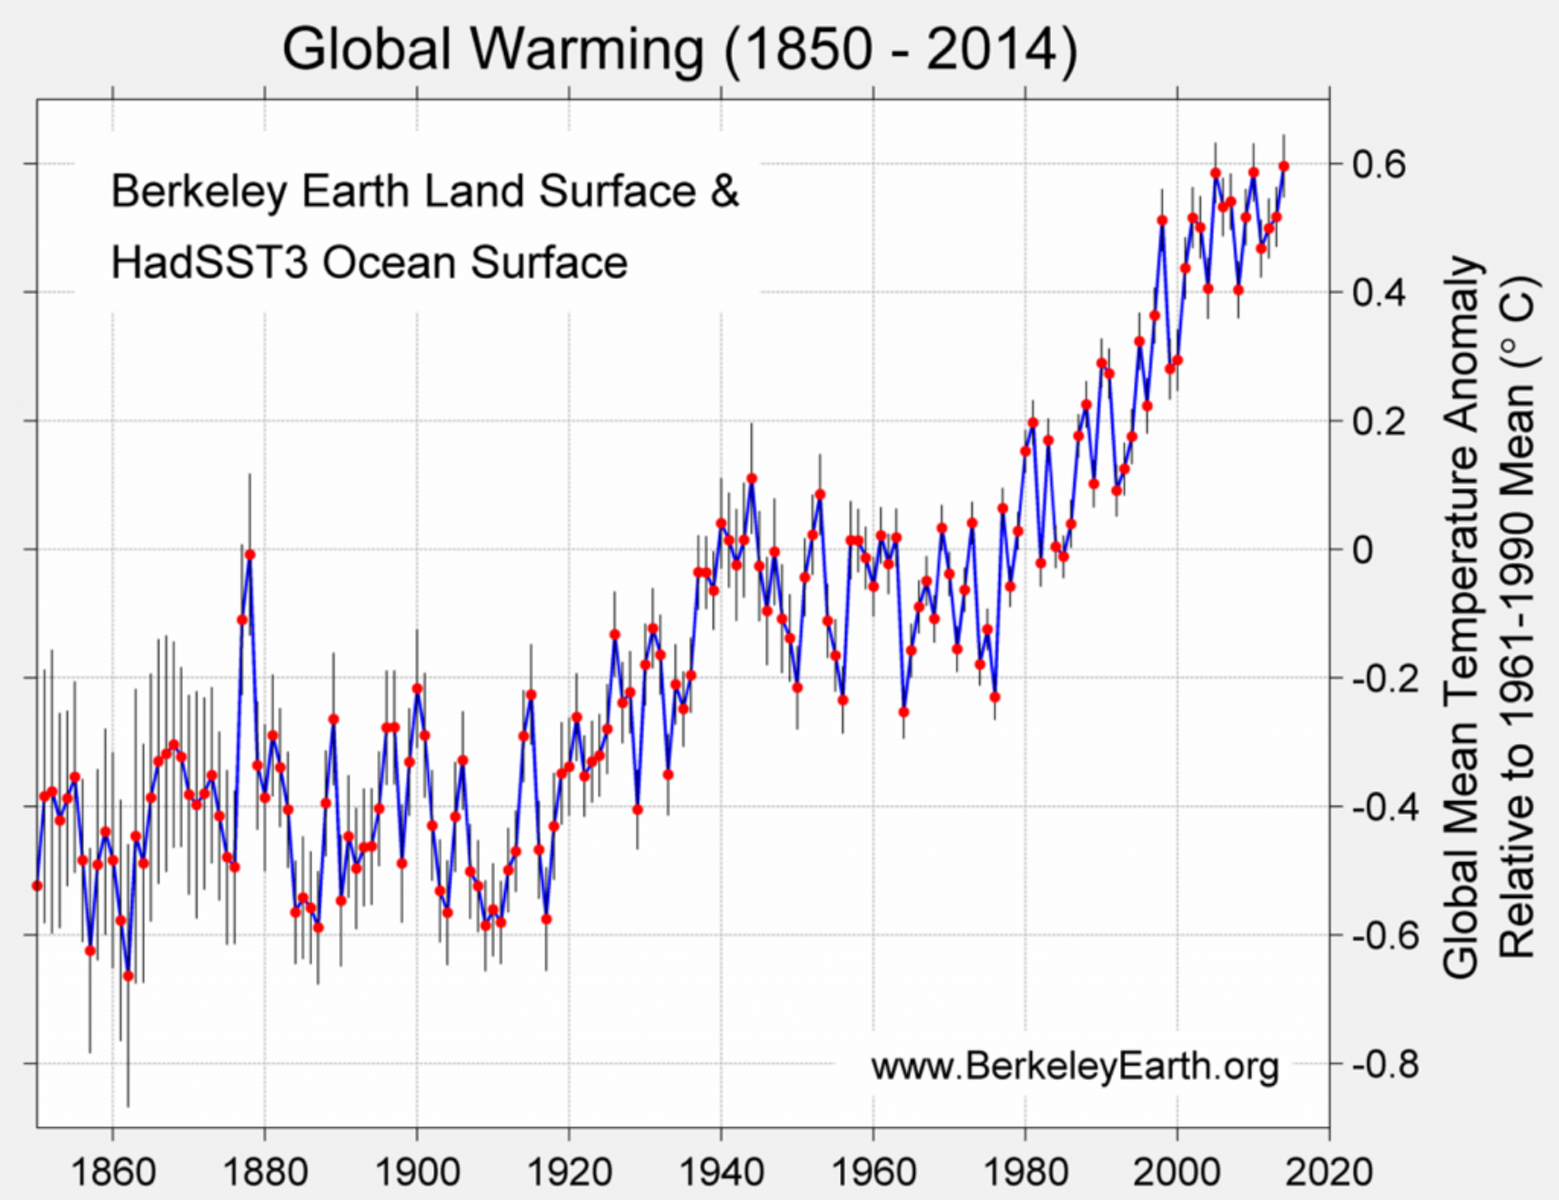
Hugsum okkur enn annaš dęmi og aftur tvęr fęrslur ķ gagnagrunninum fyrir hitafrįvik: Skošum nś gamla ferilinn hjį bresku vešurstofunni Met Office, žar sem menn kunna til verka og sżna hitaferla į réttan hįtt meš óvissumörkum. (Viš erum eingöngu aš skoša framsetninguna į myndinni og žvķ skiptir ekki mįli žó hśn sé įrsgömul, - smella į mynd til aš stękka):
Viš sjįum aš skekkjumörk įrsmešaltala sķšustu įra eru +/-0,1 en nokkrar męlingar frį 19. öld eru meš tvöfalt vķšari skekkjumörkum, eša +/-0,2°. Žetta er ekki óešlilegt. Framsetningin er til fyrirmyndar. Žrįtt fyrir žessa óvissu leyfa margir sér kinnrošalaust aš bera saman mešalhita įra žar sem munurinn er ašeins 0.01°, eša tķfalt minni en óvissumörkin. Aušvitaš ęttu menn aš vera ašeins rjóšir og feimnir žegar žeir ręša mįlin į žessum nótum, aš minnsta kosti ef žeir kunna sķn fręši. Žeim sem ekki skilja hvaš liggur aš baki svona tölum er vorkun og hlżtur aš fyrirgefast
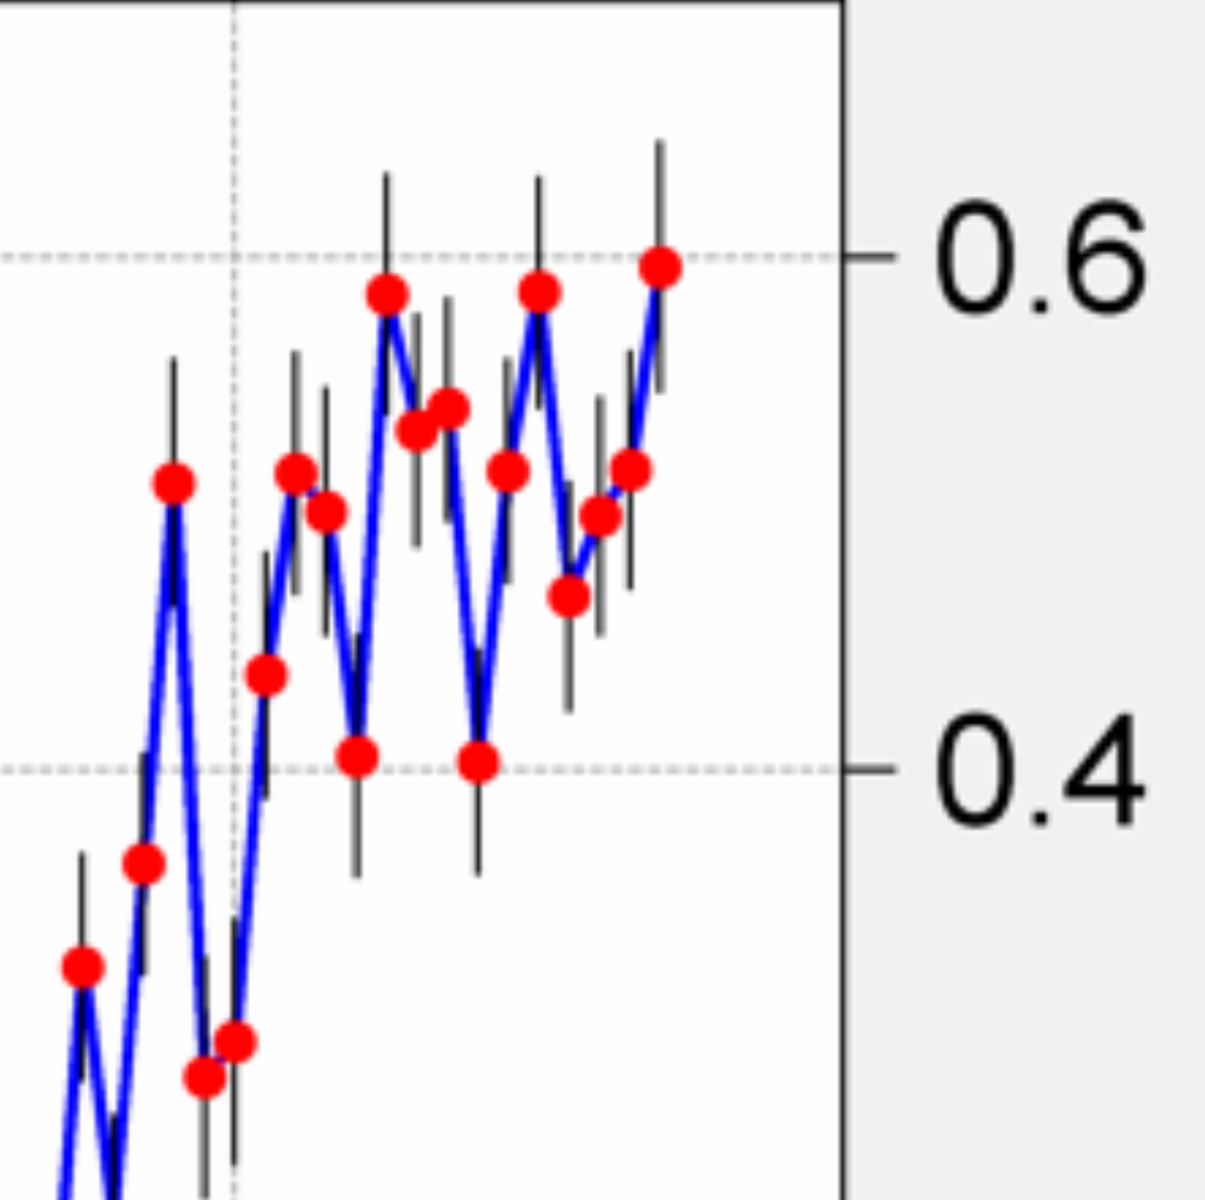
Fréttir um heitasta įriš og skeggbroddar keisarans: Žar er žessi tafla sem sżnir „topp tķu įrin“: Röš, Įr, Frįvik, Óvissumörk 1) 2014 0.596 +/- 0.049 (eša +/-0,05) Eins og viš sjįum, žį er munurinn milli įranna 2014 og 2010 ekki mikill, eša 0,596 – 0,586=0,01 grįša Celcius. Óvissumörkin eru aftur į móti +/-0,05 fyrir hvort įriš um sig, eša 5 sinnum meiri en hitamunurinn. Óvissan er sem sagt tķu sinnum meiri en mismunurinn. (Uppfęrt 21. janśar 2014: Helgi Sigvaldason verkfręšingur, sem er mjög vel aš sér ķ tölfręši og kenndi bloggaranum fyrir löngu viš HĶ, hafši samband og benti į aš ég vęri ašeins ónįkvęmur. Helgi skrifaši mešal annars:
Munurinn į įrunum 2010 og 2005 er ennžį minni, eša nįnast enginn (0,001 grįša eša 1/1000 śr grįšu). Žetta er įstęšan fyrir žvķ aš ķ skżrslunni frį Berkley stendur eftirfarandi (Žeir nota reyndar skekkjumörkin +/-0,05 ķ staš +/-0,1 sem breytir ekki nišurstöšunni): „Discussion: The margin of uncertainty we achieved was remarkably small (0.05 C with 95% confidence). This was achieved this, in part, by the inclusion of data from over 30,000 temperature stations, and by the use of optiized statistical methods. Even so, the highest year could not be distinguished. That is, of course, an indication that the Earth s average temperature for the last decade has changed very little. Note that the ten warmest years all occur since 1998“.
Sem sagt: Ekki er hęgt aš segja aš įriš 2014 hafi veriš žaš hlżjasta žvķ munurinn į įrunum 2014, 2010 og 2005 er tölfręšilega ómarktękur. Samkvęmt žessu eru žessi žrjś įr tölfręšilega jafn hlż og skipa saman efsta sętiš. Mešalhiti jaršar hefur breyst mjög lķtiš sķšasta įratug. Sjį um Berkley-Earth verkefniš hér: http://www.berkeleyearth.org
Nišurstaša um keisarans skegg: žaš veršur aš fara ósköp varlega žegar mešalhiti tveggja įra er borinn saman. Viš veršum aš gęta žess aš fullyrša ekki of mikiš og hafa fyrirvara į žvķ sem viš segjum eša skrifum og vķsa ķ skekkjumörk. Viš megum ekki vera aš deila um keisarans litlu skeggbrodda eins og jafnvel NASA varš į aš gera ķ nżlegri frétt į sķšu žeirra, og viršist sem žeir hafi gleymt žvķ sem žeir lęršu ķ framhaldsskóla um skekkjumat og framsetningu męligagna.
Smį ęfing: Hver er munurinn į 1. įrinu og 10. įrinu ķ Berkley-Earth töflunni? Prófum:
Ķtarefni:
Um skekkjumat ķ męlingum: Góšur texti frį Menntaskólanum į Akureyri (Word skjal).
--- --- ---Uppfęrt 21. janśar 2014: |

|
Jöršin hlżnar įfram |
| Tilkynna um óvišeigandi tengingu viš frétt | |
Umhverfismįl | Breytt 6.8.2019 kl. 13:53 | Slóš | Facebook | Athugasemdir (14)
Um bloggiš
Ginnungagap
Żmislegt
Loftslag
Teljari
Įlverš
Sólin ķ dag:
(Smella į mynd)
.
Olķuveršiš ķ dag:
Nżjustu fęrslur
- Kķnverskur loftbelgur yfir Amerķku, og Amerķskur belgur yfir ...
- Vķsindavefurinn: Getum viš seinkaš klukkunni į Ķslandi og fen...
- Sjįlfstęšisflokkurinn meš tęplega 19% meira fylgi en Samfylki...
- Bjarni Siguršsson harmonikkusnillingur frį Geysi. Fįein orš...
- Hvers vegna valdi Apple ekki Ķsland fyrir gagnaver...?
Heimsóknir
Flettingar
- Ķ dag (20.4.): 14
- Sl. sólarhring: 17
- Sl. viku: 79
- Frį upphafi: 762117
Annaš
- Innlit ķ dag: 4
- Innlit sl. viku: 56
- Gestir ķ dag: 4
- IP-tölur ķ dag: 4
Uppfęrt į 3 mķn. fresti.
Skżringar
Tenglar
Tenglar
Żmsar vefsķšur
- Efnisyfirlit pistla
- Lofthiti - Sjávarstaða - Hafís - Sólvirkni... Beintengdir ferlar
- Club du Soleil Greinar um samaspil sólar og vešurfars
- Stjörnufræðivefurinn
- Astronomy Picture of the Day
- Climate4you
- Watts Up With That?
- World Climate Report
- CO2 Science
- The Reference Frame
- Climate-Audit
- ICECAP
- The Air Went
- Science Sceptical Blog
- Roy Spencer
- Friends of Sience
- Prometheus
- Öldur aldanna. Sjaldan er ein báran stök - einnig í veðurfari? (2003) Vefsķša ĮHB
- Gróðurhúsaáhrif eða eðlilegar sveiflur í virkni sólar? (Grein í Lesbók Mbl. 20. júní 1998) Höfundur Įgśst H. Bjarnason
- Er jörðin að hitna?-Ekki er allt sem sýnist (1998) Vefsķša ĮHB
Uppskriftir
Żmsar mataruppskriftir
Myndaalbśm
Bloggvinir
-
 majab
majab
-
 ragu
ragu
-
 amadeus
-
 andres08
-
 apalsson
-
 asabjorg
-
 askja
askja
-
 astromix
-
 baldher
-
 biggibraga
-
 bjarkib
-
 bjarnijonsson
-
 bjarnimax
-
 bjorn-geir
-
 blindur
-
 bofs
bofs
-
 brandarar
-
 daliaa
-
 darwin
-
 duddi9
-
 ea
ea
-
 egillsv
-
 einari
-
 einarstrand
-
 elinora
-
 elvira
-
 emilhannes
-
 esv
esv
-
 eyjapeyji
-
 fhg
fhg
-
 finder
-
 finnur
-
 fjarki
-
 flinston
-
 frisk
frisk
-
 gattin
-
 geiragustsson
-
 gillimann
-
 gretaro
-
 gthg
gthg
-
 gudmbjo
-
 gudni-is
-
 gummibraga
-
 gun
gun
-
 gutti
gutti
-
 haddi9001
-
 halldorjonsson
-
 halldors
-
 hlini
hlini
-
 hof
hof
-
 hordurhalldorsson
-
 hreinsamviska
-
 hronnsig
-
 hugdettan
-
 icekeiko
-
 ingibjorgelsa
-
 jakobbjornsson
-
 jakobk
-
 johannesthor
-
 johnnyboy99
-
 jonaa
jonaa
-
 jonasgunnar
-
 jonmagnusson
-
 jonpallv
-
 jonthorolafsson
-
 juliusvalsson
-
 karljg
-
 katrinsnaeholm
-
 kikka
kikka
-
 kje
kje
-
 klarak
-
 kolbrunb
-
 krissiblo
-
 ksh
ksh
-
 kt
kt
-
 lehamzdr
-
 liljabolla
-
 lillagud
-
 lindalea
-
 lucas
lucas
-
 maeglika
-
 maggij
-
 maggiraggi
-
 marinomm
-
 martasmarta
-
 marzibil
-
 mberg
mberg
-
 midborg
-
 minos
minos
-
 morgunbladid
-
 mosi
mosi
-
 mullis
-
 naflaskodun
-
 nimbus
-
 nosejob
-
 omarbjarki
-
 ormurormur
-
 palmig
-
 perlaoghvolparnir
-
 peturmikli
-
 photo
photo
-
 possi
possi
-
 prakkarinn
-
 raggibjarna
-
 rattati
-
 ravenyonaz
-
 redlion
-
 rs1600
-
 rynir
rynir
-
 saemi7
-
 sesseljamaria
-
 sigfus
-
 sigurgeirorri
-
 sjalfstaedi
-
 sjerasigvaldi
-
 skari60
-
 skulablogg
-
 sleggjudomarinn
-
 stebbix
-
 steinibriem
-
 steinnhaf
-
 stinajohanns
-
 stjornuskodun
-
 storibjor
-
 straitjacket
-
 summi
summi
-
 tannibowie
-
 thil
thil
-
 thjodarskutan
-
 throsturg
-
 toro
toro
-
 tryggvigunnarhansen
-
 valdimarjohannesson
-
 valdinn
-
 vefritid
-
 vey
vey
-
 vidhorf
-
 vig
vig
-
 visindin
-
 vulkan
-
 kristjan9
-
 arkimedes
-
 kliddi
-
 eliasbe
Eldri fęrslur
- Febrśar 2023
- Janśar 2019
- Maķ 2018
- Jślķ 2017
- Maķ 2017
- Febrśar 2017
- Janśar 2017
- Nóvember 2016
- Október 2016
- September 2016
- Jślķ 2016
- Aprķl 2016
- Mars 2016
- Febrśar 2016
- Janśar 2016
- Desember 2015
- Nóvember 2015
- Október 2015
- Įgśst 2015
- Jśnķ 2015
- Maķ 2015
- Aprķl 2015
- Mars 2015
- Febrśar 2015
- Janśar 2015
- Desember 2014
- Nóvember 2014
- Október 2014
- September 2014
- Įgśst 2014
- Jślķ 2014
- Jśnķ 2014
- Maķ 2014
- Aprķl 2014
- Mars 2014
- Febrśar 2014
- Janśar 2014
- Desember 2013
- Nóvember 2013
- Október 2013
- September 2013
- Įgśst 2013
- Jślķ 2013
- Jśnķ 2013
- Maķ 2013
- Aprķl 2013
- Mars 2013
- Febrśar 2013
- Janśar 2013
- Desember 2012
- Nóvember 2012
- September 2012
- Įgśst 2012
- Jślķ 2012
- Jśnķ 2012
- Maķ 2012
- Aprķl 2012
- Mars 2012
- Febrśar 2012
- Janśar 2012
- Desember 2011
- Nóvember 2011
- Október 2011
- September 2011
- Įgśst 2011
- Jślķ 2011
- Jśnķ 2011
- Aprķl 2011
- Mars 2011
- Febrśar 2011
- Janśar 2011
- Desember 2010
- Nóvember 2010
- Október 2010
- September 2010
- Įgśst 2010
- Jślķ 2010
- Jśnķ 2010
- Maķ 2010
- Aprķl 2010
- Mars 2010
- Febrśar 2010
- Janśar 2010
- Desember 2009
- Nóvember 2009
- Október 2009
- September 2009
- Įgśst 2009
- Jślķ 2009
- Jśnķ 2009
- Maķ 2009
- Aprķl 2009
- Mars 2009
- Febrśar 2009
- Janśar 2009
- Desember 2008
- Nóvember 2008
- Október 2008
- September 2008
- Įgśst 2008
- Jślķ 2008
- Jśnķ 2008
- Maķ 2008
- Aprķl 2008
- Mars 2008
- Febrśar 2008
- Janśar 2008
- Desember 2007
- Nóvember 2007
- Október 2007
- September 2007
- Įgśst 2007
- Jślķ 2007
- Jśnķ 2007
- Aprķl 2007
- Mars 2007
- Febrśar 2007
- Janśar 2007
- Desember 2006
- Nóvember 2006
- Október 2006
- September 2006
Fęrsluflokkar
- Bloggar
- Bækur
- Dægurmál
- Evrópumál
- Ferðalög
- Fjármál
- Fjölmiðlar
- Heilbrigðismál
- Heimspeki
- Íþróttir
- Kjaramál
- Kvikmyndir
- Lífstíll
- Ljóð
- Löggæsla
- Mannréttindi
- Matur og drykkur
- Menning og listir
- Menntun og skóli
- Samgöngur
- Sjónvarp
- Spaugilegt
- Spil og leikir
- Stjórnmál og samfélag
- Sveitarstjórnarkosningar
- Tónlist
- Trúmál
- Trúmál og siðferði
- Tölvur og tækni
- Umhverfismál
- Utanríkismál/alþjóðamál
- Vefurinn
- Viðskipti og fjármál
- Vinir og fjölskylda
- Vísindi og fræði









 verkleg_edlisfraedi-thorsteinn_egilsson.doc


