Laugardagur, 8. janúar 2011
Undarleg fylgni milli kolsýrunnar og hitastigs. Hvað er að gerast...?
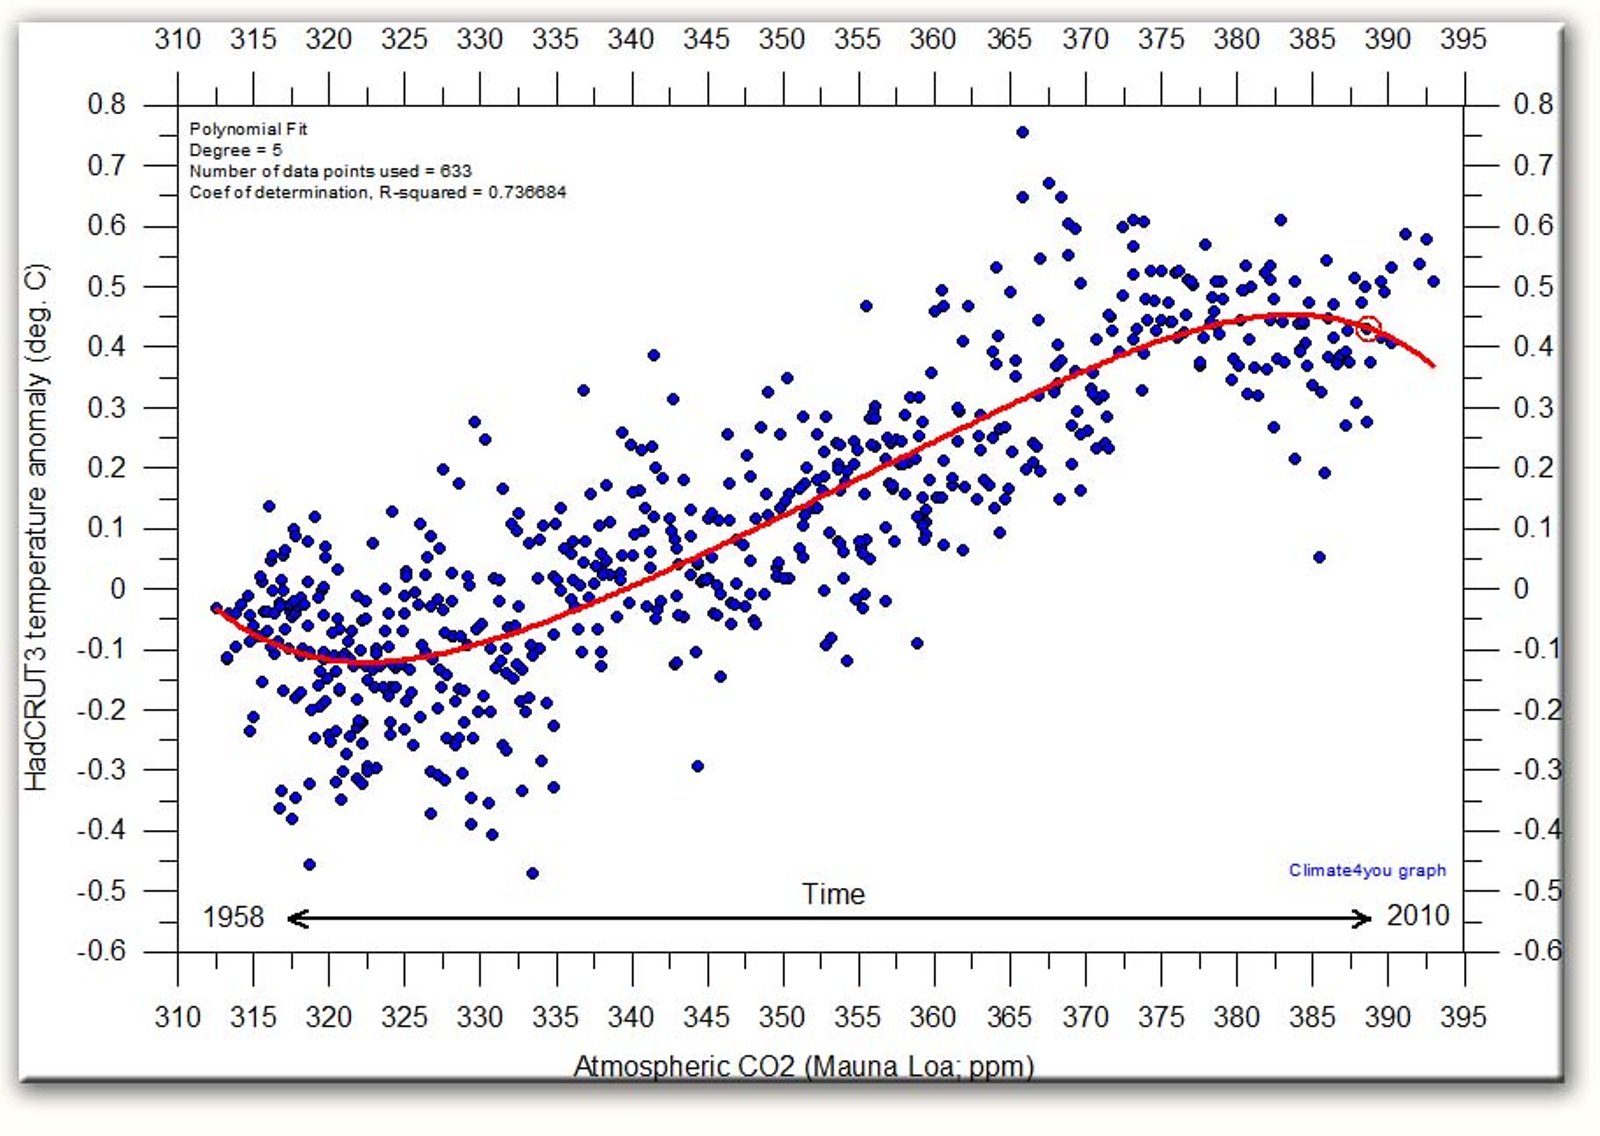
Þessi merkilega mynd er á vef prófessors Ole Humlum við Oslóarháskóla.
Á myndinni má sjá sambandið milli hitastigs lofthjúpsins og styrks CO2 síðan reglubundnar mælingar á CO2 hófust 1958.
Eitthvað merkilegt er að gerast.
Ferillinn ætti að vera sívaxandi frá vinstri til hægri, en það er hann alls ekki. Á síðustu árum fellur hitastigið með vaxandi styrk koldíoxíðs, CO2. Reyndar sést sama fyrirbærið einnig í byrjun ferilsins, þ.e. á árunum eftir 1958 þegar styrkur CO2 var miklu lægri en í dag.
Hvað segir Prófessor Ole Humlum um þetta fyrirbæri? Sjá neðst á síðunni hér.
Diagram showing HadCRUT3 monthly global surface temperature estimate plotted against the monthly atmospheric CO2 content according to the Mauna Loa Observatory, Hawaii, back to March 1958. The red line is a polynomial fit with key statistics listed in the upper left part of the diagram. Last month incorporated in the analysis: October 2010 (inside red circle). Last diagram update: 22 December 2010.
The diagram above shows all HadCRUT3 monthly temperatures plotted against the monthly Mauna Loa CO2 values, since the initiation of these measurements in 1958. As the amount of atmospheric CO2 have risen steadily since 1958, although with annual variations, the oldest values of temperature and CO2 are plotted close to the left side of the diagram, and more recent values are progressively plotted towards the right side of the diagram.
By this, the diagram illustrates that the overall relation between atmospheric CO2 and global temperature apparently has changed several times since 1958.
In the early part of the period, with CO2 concentrations close to 315 ppm, an increase of CO2 was associated with decreasing global air temperatures. When the CO2 concentration around 1975 reached 325 ppm this association changed, and increasing atmospheric CO2 was now associated with rising global temperatures. However, when the CO2 concentration at the turn of the century reached about 378 ppm, the association changed back to that characterizing the period before 1975. Thus, since 2000, increasing concentration of atmospheric CO2 has again been associated with decreasing global temperature.
The diagram above thereby demonstrates that CO2 can not have been the dominant control on global temperatures since 1958. Had CO2 been the dominant control, periods of decreasing temperature (longer than 2-5 years) with increasing CO2 values should not occur. It might be argued (IPCC 2007) that the CO2 dominance first emerged around 1975, but if so, the recent breakdown of the association around 2000 should not occur, either.
Consequently, the complex nature of the relation between global temperature and atmospheric CO2 since at least 1958 therefore represents an example of empirical falsification of the hypothesis ascribing dominance on the global temperature by the amount of atmospheric CO2. Clearly, the potential influence of CO2 must be subordinate to one or several other phenomena influencing global temperature. Presumably, it is more correct to characterize CO2 as a contributing factor for global temperature changes, rather than a dominant factor.
The breakdown of the positive temperature-CO2 relation since about 2000 (diagram above) have now lasted 10-11 years. This suggests that the recent global temperature development might deviate significantly from previous short-lived (2-5 years) periods of cooling derived from oceanic and volcanic activity as seen several times between 1975 and 2000. There are two possibilities: 1) Global air temperatures may again begin to increase in a short while. 2) The recent development may represent the beginning of a more thorough and long-lasting cooling, perhaps similar to the cooling period after 1940. As usual, time will show what is correct.
Ekki vil ég reyna að bæta nokkru við þessi orð prófessorsins og ekki er við bloggarann að eiga ef einhverjum mislíkar hegðun náttúrunnar eða skrif Dr. Ole Humlum.
Hitamæligögn eru frá hinni virtu stofnun Climate Research Unit. CO2 gögn eru frá NOAA.
Sjá nánar síðuna Climate Reflections sem er einn kafli vefsíðunnar Climate4You.com
Á vef prófessors Ole Humlum er fjölmargt fróðlegt. M.a. er myndin sem er hér fyrir neðan þaðan.
Smella má tvisvar á myndir til að stækka
Um prófessor Ole Humlum
Smella hér til að sjá greinasafn prófessorsins
"Margt er skrýtið í kýrhausnum"
Vísindi og fræði | Breytt 10.1.2011 kl. 18:22 | Slóð | Facebook | Athugasemdir (27)
Bloggfærslur 8. janúar 2011
Um bloggið
Ginnungagap
Ýmislegt
Loftslag
Teljari
Álverð
Sólin í dag:
(Smella á mynd)
.
Olíuverðið í dag:
Nýjustu færslur
- Kínverskur loftbelgur yfir Ameríku, og Amerískur belgur yfir ...
- Vísindavefurinn: Getum við seinkað klukkunni á Íslandi og fen...
- Sjálfstæðisflokkurinn með tæplega 19% meira fylgi en Samfylki...
- Bjarni Sigurðsson harmonikkusnillingur frá Geysi. Fáein orð...
- Hvers vegna valdi Apple ekki Ísland fyrir gagnaver...?
Heimsóknir
Flettingar
- Í dag (20.4.): 6
- Sl. sólarhring: 11
- Sl. viku: 67
- Frá upphafi: 766361
Annað
- Innlit í dag: 3
- Innlit sl. viku: 42
- Gestir í dag: 3
- IP-tölur í dag: 3
Uppfært á 3 mín. fresti.
Skýringar
Tenglar
Tenglar
Ýmsar vefsíður
- Efnisyfirlit pistla
- Lofthiti - Sjávarstaða - Hafís - Sólvirkni... Beintengdir ferlar
- Club du Soleil Greinar um samaspil sólar og veðurfars
- Stjörnufræðivefurinn
- Astronomy Picture of the Day
- Climate4you
- Watts Up With That?
- World Climate Report
- CO2 Science
- The Reference Frame
- Climate-Audit
- ICECAP
- The Air Went
- Science Sceptical Blog
- Roy Spencer
- Friends of Sience
- Prometheus
- Öldur aldanna. Sjaldan er ein báran stök - einnig í veðurfari? (2003) Vefsíða ÁHB
- Gróðurhúsaáhrif eða eðlilegar sveiflur í virkni sólar? (Grein í Lesbók Mbl. 20. júní 1998) Höfundur Ágúst H. Bjarnason
- Er jörðin að hitna?-Ekki er allt sem sýnist (1998) Vefsíða ÁHB
Uppskriftir
Ýmsar mataruppskriftir
Myndaalbúm
Bloggvinir
-
 majab
majab
-
 ragu
ragu
-
 amadeus
-
 andres08
-
 apalsson
-
 asabjorg
-
 askja
askja
-
 astromix
-
 baldher
-
 biggibraga
-
 bjarkib
-
 bjarnijonsson
-
 bjarnimax
-
 bjorn-geir
-
 blindur
-
 bofs
bofs
-
 brandarar
-
 daliaa
-
 darwin
-
 duddi9
-
 ea
ea
-
 egillsv
-
 einari
-
 einarstrand
-
 elinora
-
 elvira
-
 emilhannes
-
 esv
esv
-
 eyjapeyji
-
 fhg
fhg
-
 finder
-
 finnur
-
 fjarki
-
 flinston
-
 frisk
frisk
-
 gattin
-
 geiragustsson
-
 gillimann
-
 gretaro
-
 gthg
gthg
-
 gudmbjo
-
 gudni-is
-
 gummibraga
-
 gun
gun
-
 gutti
gutti
-
 haddi9001
-
 halldorjonsson
-
 halldors
-
 hlini
hlini
-
 hof
hof
-
 hordurhalldorsson
-
 hreinsamviska
-
 hronnsig
-
 hugdettan
-
 icekeiko
-
 ingibjorgelsa
-
 jakobbjornsson
-
 jakobk
-
 johannesthor
-
 johnnyboy99
-
 jonaa
jonaa
-
 jonasgunnar
-
 jonmagnusson
-
 jonpallv
-
 jonthorolafsson
-
 juliusvalsson
-
 karljg
-
 katrinsnaeholm
-
 kikka
kikka
-
 kje
kje
-
 klarak
-
 kolbrunb
-
 krissiblo
-
 ksh
ksh
-
 kt
kt
-
 lehamzdr
-
 liljabolla
-
 lillagud
-
 lindalea
-
 lucas
lucas
-
 maeglika
-
 maggij
-
 maggiraggi
-
 marinomm
-
 martasmarta
-
 marzibil
-
 mberg
mberg
-
 midborg
-
 minos
minos
-
 morgunbladid
-
 mosi
mosi
-
 mullis
-
 naflaskodun
-
 nimbus
-
 nosejob
-
 omarbjarki
-
 ormurormur
-
 palmig
-
 perlaoghvolparnir
-
 peturmikli
-
 photo
photo
-
 possi
possi
-
 prakkarinn
-
 raggibjarna
-
 rattati
-
 ravenyonaz
-
 redlion
-
 rs1600
-
 rynir
rynir
-
 saemi7
-
 sesseljamaria
-
 sigfus
-
 sigurgeirorri
-
 sjalfstaedi
-
 sjerasigvaldi
-
 skari60
-
 skulablogg
-
 sleggjudomarinn
-
 stebbix
-
 steinibriem
-
 steinnhaf
-
 stinajohanns
-
 stjornuskodun
-
 storibjor
-
 straitjacket
-
 summi
summi
-
 tannibowie
-
 thil
thil
-
 thjodarskutan
-
 throsturg
-
 toro
toro
-
 tryggvigunnarhansen
-
 valdimarjohannesson
-
 valdinn
-
 vefritid
-
 vey
vey
-
 vidhorf
-
 vig
vig
-
 visindin
-
 vulkan
-
 kristjan9
-
 arkimedes
-
 kliddi
-
 eliasbe
Eldri færslur
- Febrúar 2023
- Janúar 2019
- Maí 2018
- Júlí 2017
- Maí 2017
- Febrúar 2017
- Janúar 2017
- Nóvember 2016
- Október 2016
- September 2016
- Júlí 2016
- Apríl 2016
- Mars 2016
- Febrúar 2016
- Janúar 2016
- Desember 2015
- Nóvember 2015
- Október 2015
- Ágúst 2015
- Júní 2015
- Maí 2015
- Apríl 2015
- Mars 2015
- Febrúar 2015
- Janúar 2015
- Desember 2014
- Nóvember 2014
- Október 2014
- September 2014
- Ágúst 2014
- Júlí 2014
- Júní 2014
- Maí 2014
- Apríl 2014
- Mars 2014
- Febrúar 2014
- Janúar 2014
- Desember 2013
- Nóvember 2013
- Október 2013
- September 2013
- Ágúst 2013
- Júlí 2013
- Júní 2013
- Maí 2013
- Apríl 2013
- Mars 2013
- Febrúar 2013
- Janúar 2013
- Desember 2012
- Nóvember 2012
- September 2012
- Ágúst 2012
- Júlí 2012
- Júní 2012
- Maí 2012
- Apríl 2012
- Mars 2012
- Febrúar 2012
- Janúar 2012
- Desember 2011
- Nóvember 2011
- Október 2011
- September 2011
- Ágúst 2011
- Júlí 2011
- Júní 2011
- Apríl 2011
- Mars 2011
- Febrúar 2011
- Janúar 2011
- Desember 2010
- Nóvember 2010
- Október 2010
- September 2010
- Ágúst 2010
- Júlí 2010
- Júní 2010
- Maí 2010
- Apríl 2010
- Mars 2010
- Febrúar 2010
- Janúar 2010
- Desember 2009
- Nóvember 2009
- Október 2009
- September 2009
- Ágúst 2009
- Júlí 2009
- Júní 2009
- Maí 2009
- Apríl 2009
- Mars 2009
- Febrúar 2009
- Janúar 2009
- Desember 2008
- Nóvember 2008
- Október 2008
- September 2008
- Ágúst 2008
- Júlí 2008
- Júní 2008
- Maí 2008
- Apríl 2008
- Mars 2008
- Febrúar 2008
- Janúar 2008
- Desember 2007
- Nóvember 2007
- Október 2007
- September 2007
- Ágúst 2007
- Júlí 2007
- Júní 2007
- Apríl 2007
- Mars 2007
- Febrúar 2007
- Janúar 2007
- Desember 2006
- Nóvember 2006
- Október 2006
- September 2006
Færsluflokkar
- Bloggar
- Bækur
- Dægurmál
- Evrópumál
- Ferðalög
- Fjármál
- Fjölmiðlar
- Heilbrigðismál
- Heimspeki
- Íþróttir
- Kjaramál
- Kvikmyndir
- Lífstíll
- Ljóð
- Löggæsla
- Mannréttindi
- Matur og drykkur
- Menning og listir
- Menntun og skóli
- Samgöngur
- Sjónvarp
- Spaugilegt
- Spil og leikir
- Stjórnmál og samfélag
- Sveitarstjórnarkosningar
- Tónlist
- Trúmál
- Trúmál og siðferði
- Tölvur og tækni
- Umhverfismál
- Utanríkismál/alþjóðamál
- Vefurinn
- Viðskipti og fjármál
- Vinir og fjölskylda
- Vísindi og fræði


