Bloggfærslur mánaðarins, október 2011
Mánudagur, 31. október 2011
Skógar gætu bundið meira CO2 en áður var talið...
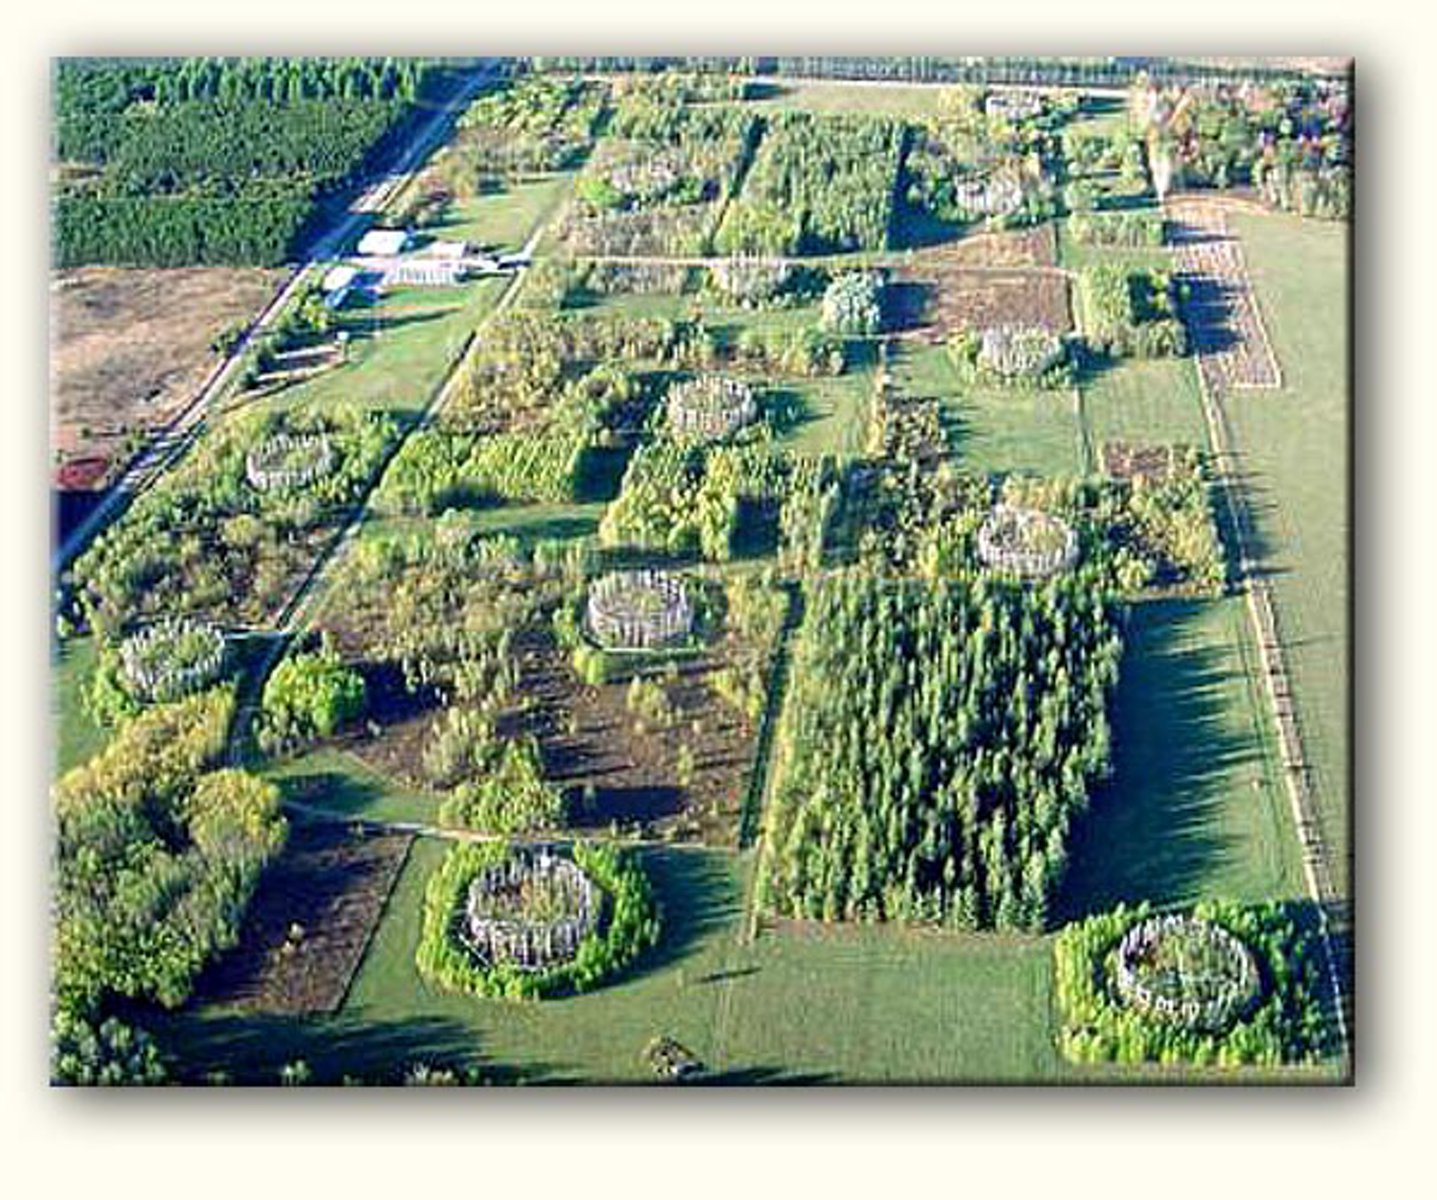
Fróðleg grein um skóga birtist fyrir skömmu á Science Daily vefnum. Samkvæmt greininni virðist sem skógurinn hafi meiri hæfileika til að binda koltvísýring en áður var talið. Greinin er hér. Í tilrauninni, sem stóð yfir í 12 ár á um 20 hektara landi, var styrkur koltvísýrings umhverfis trjákrónurnar aukinn, auk þess sem notað var ózon til að líkja eftir menguðu lofti. Auk þess sem talið er að aukið magn koltvísýrings hafi áhrif til hækkunar hitastigs, virkar það sem áburður á vöxt gróðurs, eins og fram kemur í greininni sem birt er hér fyrir neðan. Fyrri rannsóknir höfðu gefið til kynna að þessi áhrif á vöxt trjánna væru tímabundin, þar sem að því kæmi að plönturnar næðu ekki nægu magni að köfnunarefni eða nitur úr jarðveginum. Í ljós kom í þessari tilraun að vöxtur trjánna hélst hraður allan tíman sem rannsóknin fór fram, og síðustu 3 árin var vaxtarhraðinn 26% meiri en samanburðartrjánna sem fengu ekki aukið magn koltvísýrings. Svo virðist sem hæfileiki trjánna til að vinna köfnunarefi úr jarðveginum hafi aukist, og einnig að örverur hafi skilað aftur köfnunarefni hraðar í jarðveginn með auknu magni laufa sem féllu af trjánum að hausti. Heildaráhrif ózons á skóginn voru lítil, þó svo gróðurinn þyldi það misvel. Ýmislegt fleira fróðlegt kom fram í tilrauninni og er vel þess virði að lesa allan greinarstúfinn sem hér fylgir. Þetta eru ánægjulegar fréttir fyrir skógræktarfólk og einnig þá sem áhyggjur hafa að hækkuðu hitastigi jarðar.
Myndin hér að ofan sýnir tilraunareitinn sem er 38 ekrur að stærð. Tilraunin stóð yfir á árunum 1997-2008
|
Vísindi og fræði | Breytt 1.11.2011 kl. 07:49 | Slóð | Facebook
Sunnudagur, 30. október 2011
Einn höfunda BEST skýrsunnar í loftslagsmálum ásakar aðalhöfundinn um að villa um fyrir fólki...
Ja hérna hér... Sá fáheyrði atburður hefur gerst að einn höfunda svokallaðrar BEST greinar sem kennd er við Berkley háskóla hefur ásakað aðalhöfundinn um að hafa vísvitandi beitt blekkingum þegar skýrslan var kynnt. (BEST = Berkley Earth Surface Temperature). Um þessa greinar hefur verið fjallað hér á bloggsíðu Einars Sveinbjörnssonar og hér á bloggsíðu Loftslag.is. Sjálfur fjallaði ég aðeins um málið í athugasemdum #6, #12, #13 og #18 í bloggpistli Einars hér. Aðalhöfundur skýrslunnar er prófessor Richard Muller sem er eðlisfræðingur mað áhuga á stjarnelisfræði og starfar sem prófessor hjá Berkeley háskóla. Einn höfunda er prófessor Judith Curry sem er loftslagsfræðingur og veitir forstöðu Department of Earth and Atmospheric Sciences hjá Georgia Institute of Technology. Vefsíða Dr. Curry, Climate Etc.
Sjá grein sem var að birtast á vefsíðu Daily Mail, Mail Online:
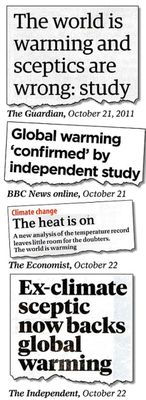
Örstuttur úrdráttur úr greininni sam nauðsynlegt er að lesa í heild sinni með því að smella á fyrirsögnina: By David Rose Last updated at 5:41 AM on 30th October 2011 It was hailed as the scientific study that ended the global warming debate once and for all – the research that, in the words of its director, ‘proved you should not be a sceptic, at least not any longer’. Professor Richard Muller, of Berkeley University in California, and his colleagues from the Berkeley Earth Surface Temperatures project team (BEST) claimed to have shown that the planet has warmed by almost a degree centigrade since 1950 and is warming continually.... ... But today The Mail on Sunday can reveal that a leading member of Prof Muller’s team has accused him of trying to mislead the public by hiding the fact that BEST’s research shows global warming has stopped. Prof Judith Curry, who chairs the Department of Earth and Atmospheric Sciences at America’s prestigious Georgia Institute of Technology, said that Prof Muller’s claim that he has proven global warming sceptics wrong was also a ‘huge mistake’, with no scientific basis. Prof Curry is a distinguished climate researcher with more than 30 years experience and the second named co-author of the BEST project’s four research papers.... ... Prof Muller also wrote an article for the Wall Street Journal. It was here, under the headline ‘The case against global warming scepticism’, that he proclaimed ‘there were good reasons for doubt until now’. Media storm: Prof Muller's claims received uncritical coverage in the media this week:
Such claims left Prof Curry horrified. ‘Of course this isn’t the end of scepticism,’ she said. ‘To say that is the biggest mistake he [Prof Muller] has made. When I saw he was saying that I just thought, “Oh my God”.’ In fact, she added, in the wake of the unexpected global warming standstill, many climate scientists who had previously rejected sceptics’ arguments were now taking them much more seriously. ...
Sjá einnig grein um málið eftir Dr. David Whitehouse:
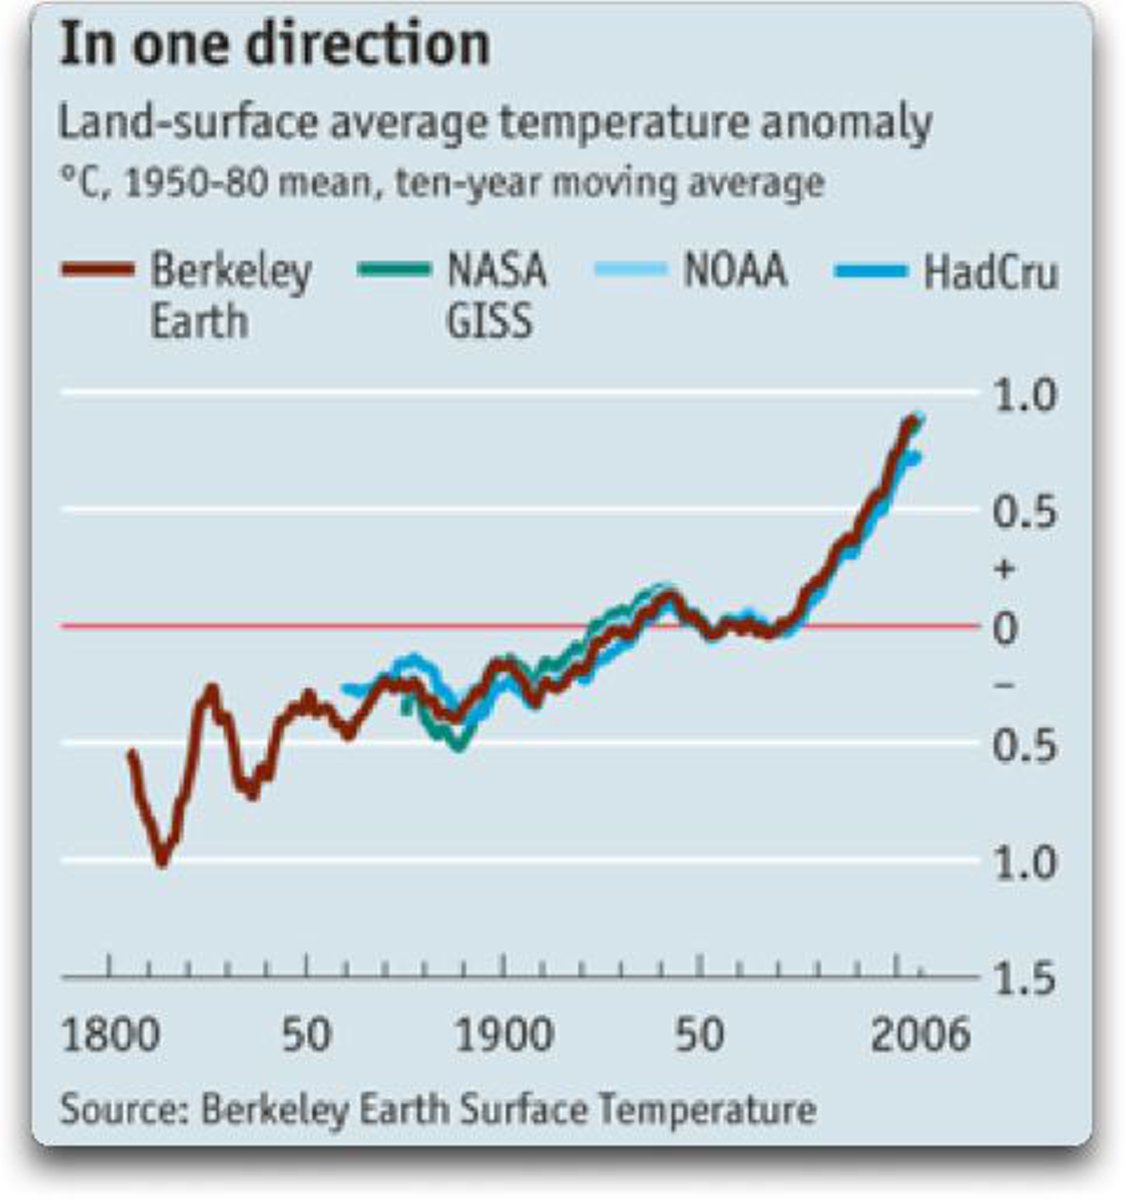
Það er rétt að árétta að þetta mál fjallar um þá aðferð sem notuð var til að kynna niðurstöður BEST og endurspeglast m.a. í fyrirsögnunum sem myndin er af hér fyrir ofan, en málið fjallar ekki um þau gögn sem notuð voru. Þau eru aðgengileg á netinu hverjum þeim sem vill nota þau til að skoða raunverulegar niðurstöður. Dr. Curry er sem sagt að gagnrýna kynninguna, sem hún telur hafa gefið ranga mynd, sérstaklega þar sem gefið er til kynna " “end of skepticism” og “We see no evidence of global warming slowing down.” Það er ekki verið að gagnrýna aðferðafræðina sem vissulega er áhugaverð. Bloggsíða Dr. Judith Curry Climate Etc. ---
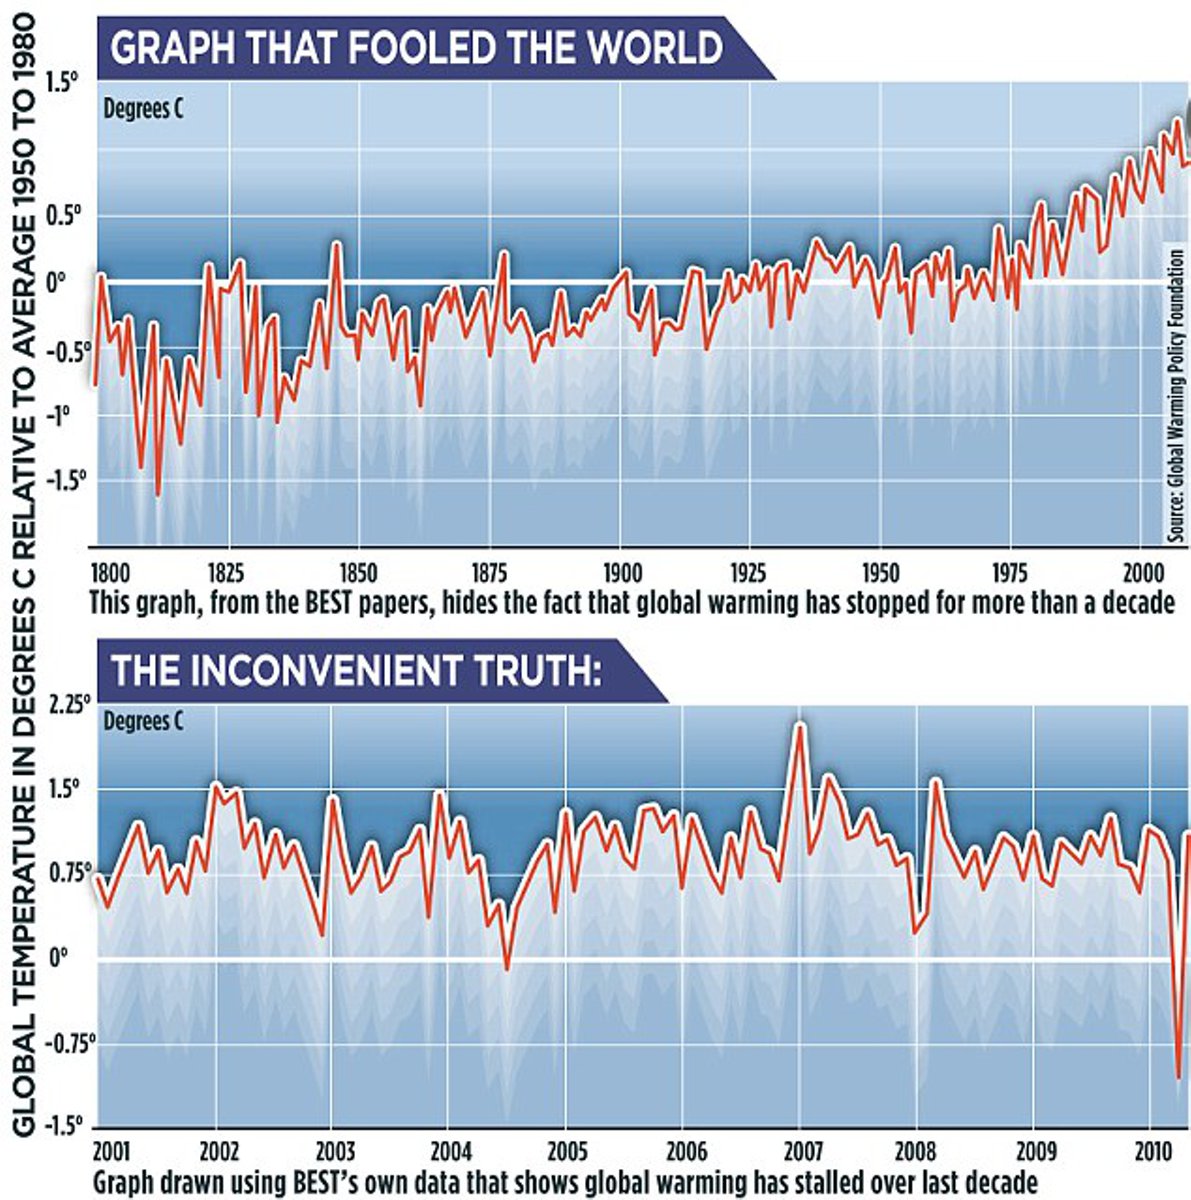
Mynd úr greininni í Mail Online í gær:
(Takið eftir að efri ferillinn nær yfir 100 ára tímabil, en sá neðri 10 ára tímabil)
Þessi mynd fylgdi BEST kynningunni um daginn: Etv. mætti kalla svona mynd BEST Propaganda
Greinarnar umræddu eru hér:
Um BEST á Wikipedia: http://en.wikipedia.org/wiki/Berkeley_Earth_Surface_Temperature
---
Uppfært klukkan 13:00, 30. október. Dr. Judith Curry fjallar um greinina í Mail Online hér. Hún skrifar: Last week I spoke with David Rose of the Mail about the BEST publicity and PR, and Richard Muller’s public statements. The resulting article is [here]. I discussed some concerns I had about the BEST PR on this previous thread. In David Rose’s article, the direct quotes attributed to me are correct. To set the record straight, some of the other sentiments attributed to me are not quite right, I will discuss these here. “Hiding the truth” in the title is definitely misleading, I made it pretty clear that there was uncertainty in the data itself, but the bigger issues are to analyze the data and interpret it. I made it clear that this was not a straightforward and simple thing to do. I told Rose that I was puzzled my Muller’s statements, particularly about “end of skepticism” and also “We see no evidence of global warming slowing down.” I did not say that “the affair had to be compared to the notorious Climategate scandal two years ago,” this is indirectly attributed to me. When asked specifically about the graph that apparently uses a 10 year running mean and ends in 2006, we discussed “hide the decline,” but I honestly can’t recall if Rose or I said it first. I agree that the way the data is presented in the graph “hides the decline.” There is NO comparison of this situation to Climategate. Muller et al. have been very transparent in their methods and in making their data publicly available, which is highly commendable. My most important statement IMO is this: ‘To say that there is detracts from the credibility of the data, which is very unfortunate.’ My main point was that this is a very good data set, the best we currently have available for land surface temperatures. To me, this should have been the big story: a new comprehensive data set, put together by a team of physicists and statisticians with private funds. Showing preliminary results is of course fine, but overselling them at this point was a mistake IMO. I arrived in Santa Fe yesterday. More on the Conference in a forthcoming post. Muller and Rohde will be at the conference, I will be meeting them for the first time and I will try to understand what is going on here. And finally, this is NOT a new scandal. An important new data set has been released. Some new papers have been posted for comments, which are not surprisingly drawing criticism and controversy. The main issue seems to be Richard Muller’s public statements. All this does not constitute a new scientific scandal in any way. My continued collaboration on this project will be discussed this week with Muller and Rohde. My joining this group was somewhat unusual, in that I did not know any of these people prior to being invited to join their team (although I very quickly figured out that they were highly reputable scientists). I thought the project was a great idea, and I still do, but it currently has a tarnish on it. Lets see what we can do about this. Nánar hér |
Ja hérna hér, er eitthvað mikið deilumál í uppsiglingu?...
Vísindi og fræði | Breytt 31.10.2011 kl. 18:27 | Slóð | Facebook | Athugasemdir (8)
Laugardagur, 29. október 2011
Hvers vegna hefur hnatthlýnunin staðið í stað það sem af er þessari öld...?
Vísindamenn spyrja: "Hvernig i ósköpunum stendur á því, að þrátt fyrir síaukna losun manna á koltvísýringi, þá hefur hlýnun jarðar nánast staðið í stað á þessari öld ???"
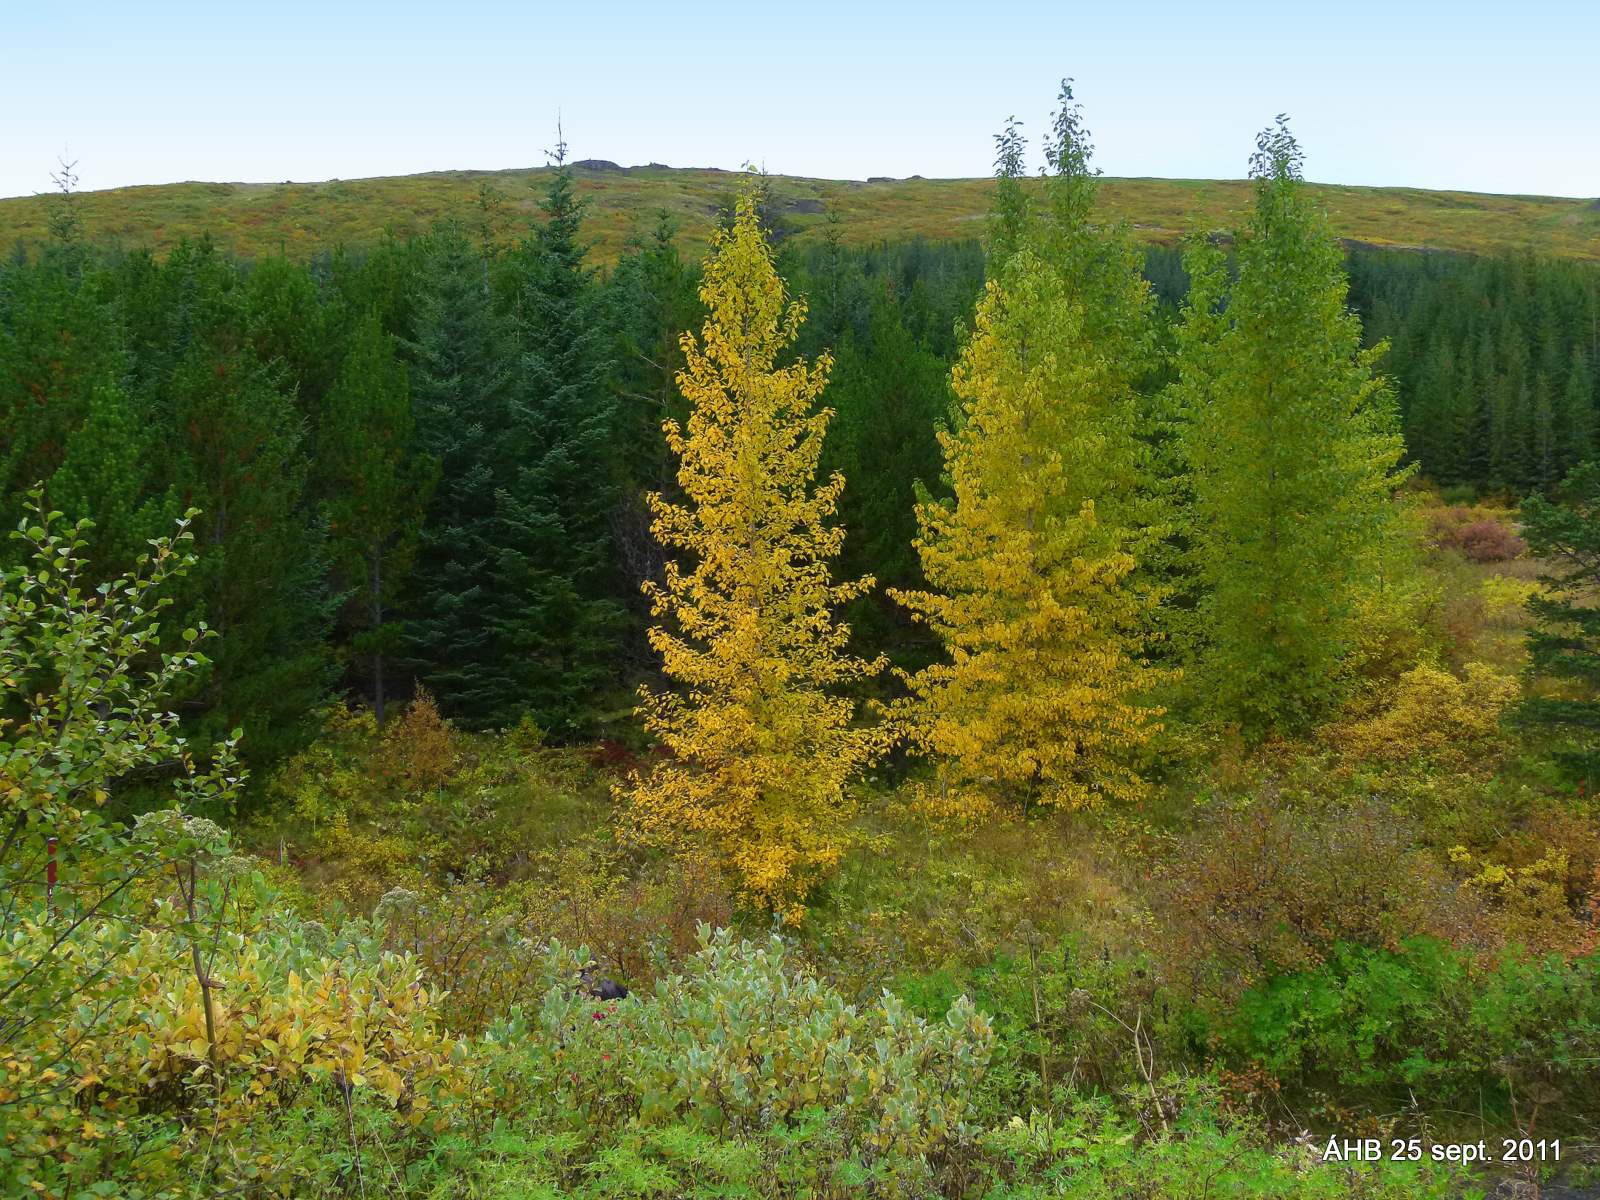
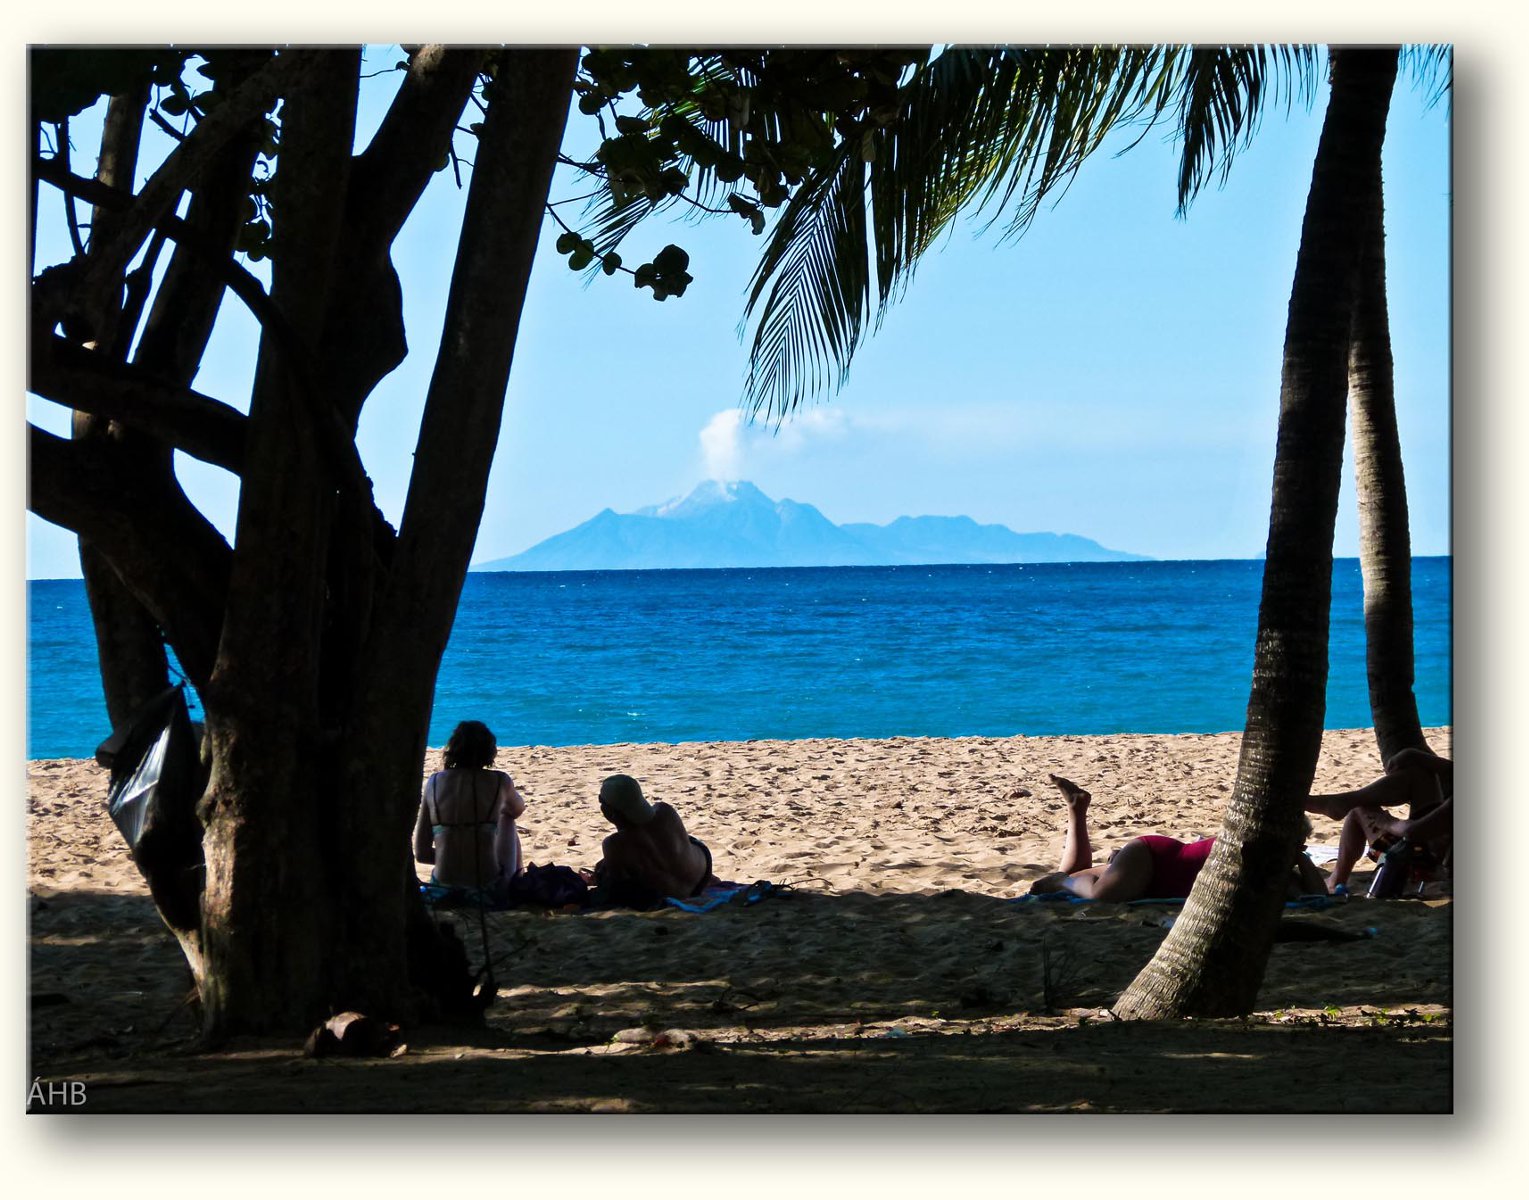
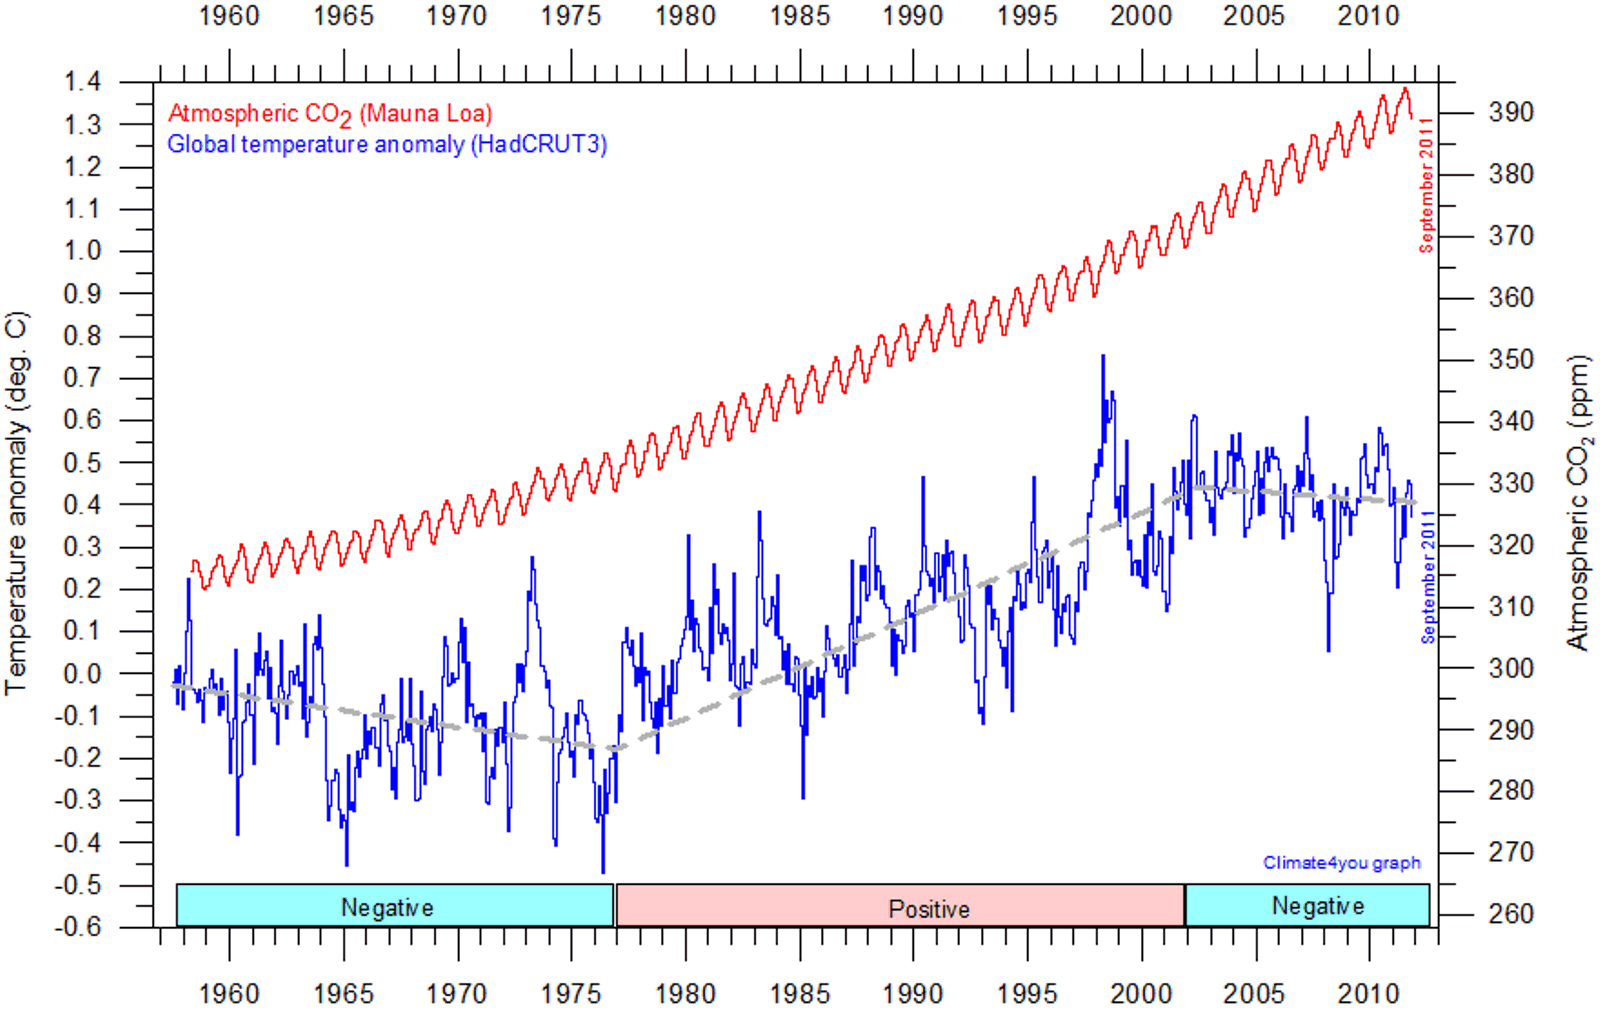
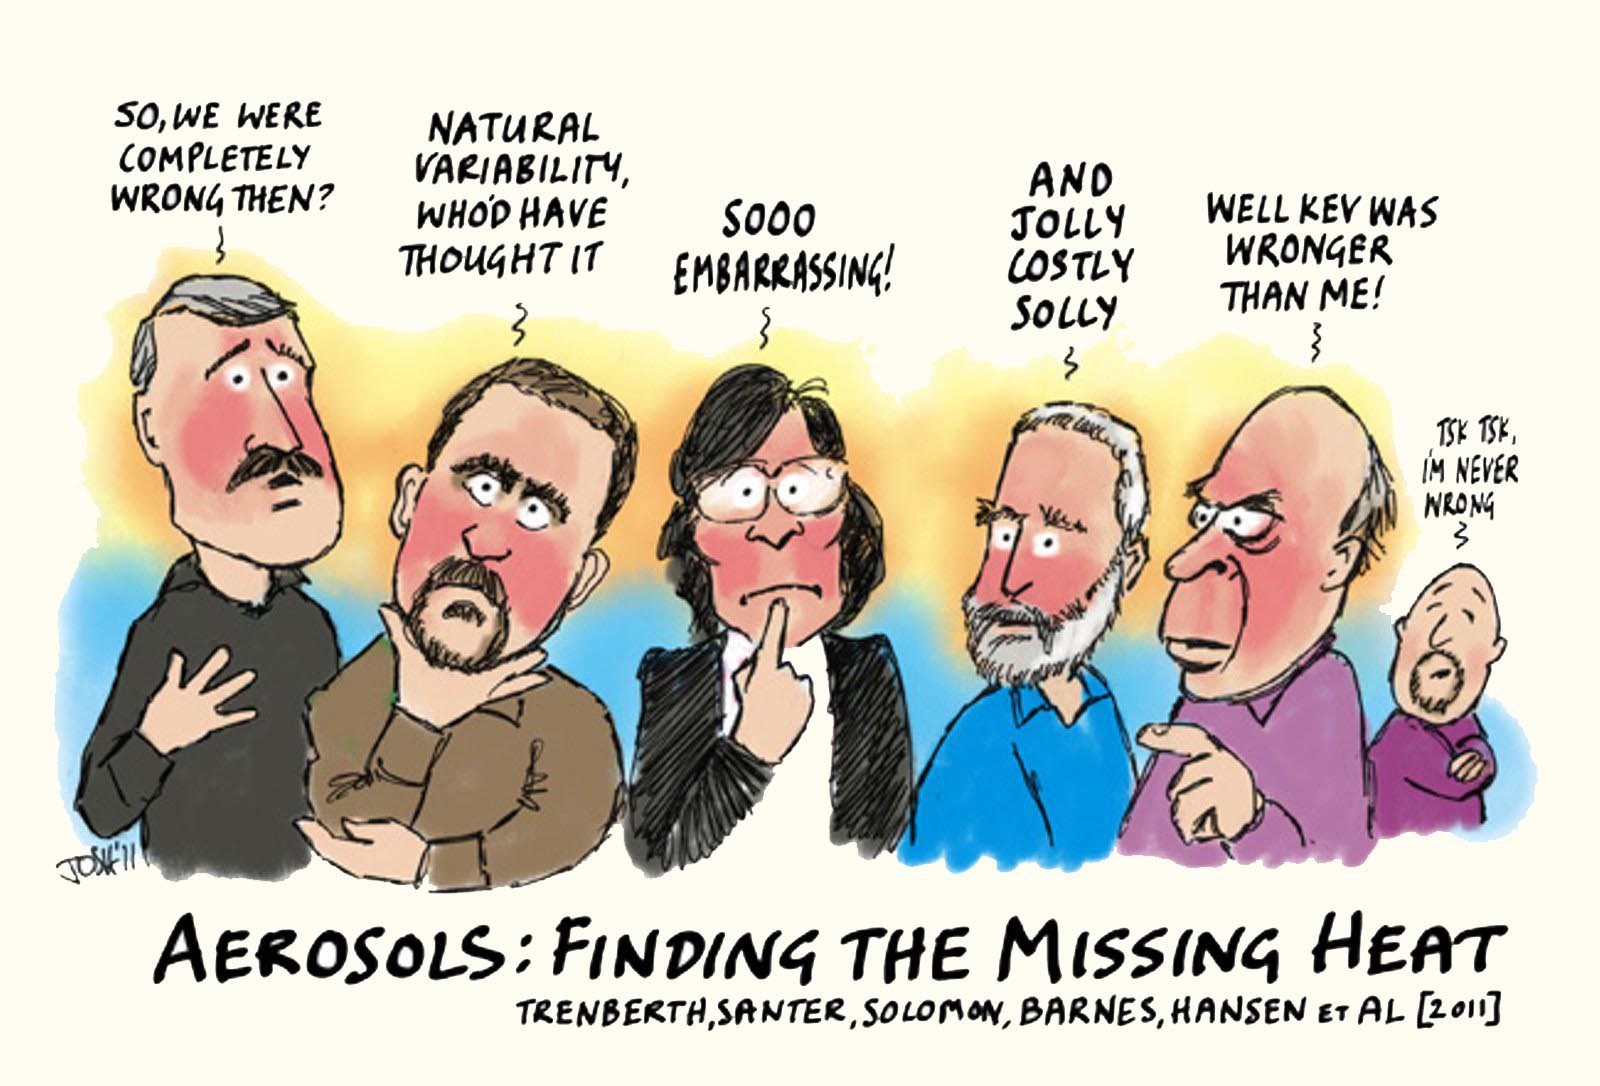
Þetta er spurning sem brennur á vörum margra vísindamanna. Paul Voosen, sem margir þekkja af góðu, en hann hefur skrifað fjölda góðra greina, m.a. í Scientific American, skrifaði nýlega skemmtilega og fróðlega grein sem hann nefnir Provoked scientists try to explain lag in global warming. Greinina má lesa í heild sinni hér. Greinin er nokkuð löng og hefur Dr. Roger Pielke Sr. prófessor tekið saman úrdrátt þar sem aðalatriði greinarinnar eru feitletruð. Það auðveldar lesturinn. Sjá Candid Comments From Climate Scientists á vefsíðu Pielke. Dr. Judith Curry pófessor í loftslagsfræðum fjallar um greinina hér á bloggi sínu og er með ýmsar góðar athugasemdir, ábendingar og spurningar til nokkurra þessara visindamanna. Hún veitir forstöðu School of Earth and Atmospheric Sciences við Georgia Institute of Technology. Í þessari löngu grein Paul Voosen fjallar hann um hvernig fjölmargir þekktir vísindamenn hafa reynt að útskýra þetta hik, en ljóst er að allir eru þeir meira og minna ósammála og engin einhlít skýring á þessu hefur fengist. Það er greinilegt að um þetta fyrirbæri er ekki neitt samdóma álit vísindamanna eða "scientific concensus" eins og það heitir á fínni útlensku. Það er óþarfi að endursegja það sem stendur í umræddri grein, en vísindamennirnir sem koma við sögu eru þessir (mynd af nokkrum þeirra er neðst á síðunni): John Barnes Jean-Paul Vernier Kevin Trenberth Susan Solomon Jim Hansen John Daniel Ben Santer Judith Lean Graeme Stephens Robert Kaufmann Martin Wild Daniel Jacobs Þeir hafa reynt, hver á sinn hátt, að kenna ýmsu um þessa stöðnun sem varð strax í byrjun aldarinnar. Meðal annars hafa þeir nefnt til sögu möguleikann á loftbornum ögnum frá nokkrum meðal öflugum eldgosum, þar á meðal frá eldfjallinu MontSerrat sem prýðir pistilinn, en þessa mynd tók ég í desember síðastliðnum þegar ég var við störf á eyju þar skammt frá í Vestur-Indíum eða Karabíska hafinu, þ.e. Guadeloupe. Síðar beindu menn sjónum að kolaorkuverum í Kína, fyrribærum í hafinu, sérstaklega Kyrrahafi, og jafnvel sólinni sem er jú uppspretta hitans. Menn hafa lagt höfuðið í bleyti og hugsað stíft, en allt kemur fyrir ekki eins og lesa má um í greininni Candid Comments From Climate Scientists. Kannski er þetta bara hik og kannski mun hitastig lofthjúpsins taka að hækka á nýjan leik innan skamms, en getur verið að hámarkinu sé náð og hitinn taki að lækka aftur? Auðvitað má ekki hugsa svona, því það er víst samdóma álit vísindamanna að lofthjúpurinn muni halda áfram að hitna um ókomin ár... Á myndinni hér fyrir neðan, sem fengin er að láni hér hjá Ole Humlum prófessor við Oslóarháskóla, má greinilega sjá þetta hik sem varð eftir hraða hækkun hitastigs á tveim áratugum fyrir aldamótin.
Rauði ferillinn er aukning koltvísýrings í andrúmsloftinu. Blái ferillinn sýnir breytingar í lofthita frá því er mælingar á koltvísýringi hófust á Mauna Loa fjalli á Havaí eyjum árið 1958. Gráa strikaða línan afmarkar þrjú tímabil þar sem hitinn fer aðeins lækkandi, síðan hækkandi og að lokum sést hikið frá síðustu aldamótum (eða 2002) sem kemur mönnum í opna skjöldu.
"Indeed, many of the scientists sorting out the warming hiatus disagree with one another -- in a chummy, scholarly way. Judith Lean, the solar scientist, finds Kaufmann's work unpersuasive and unnecessarily critical of China. Kaufmann finds Solomon's stratosphere studies lacking in evidence. Hansen and Trenberth can't agree on a budget" stendur neðarlega í grein Paul Voosen.
Þá vitum vér það... eða öllu heldur, vitum ekki.
|
Vísindi og fræði | Breytt s.d. kl. 07:02 | Slóð | Facebook | Athugasemdir (21)
Sunnudagur, 9. október 2011
Sjávarborð hefur farið lækkandi undanfarið ár...
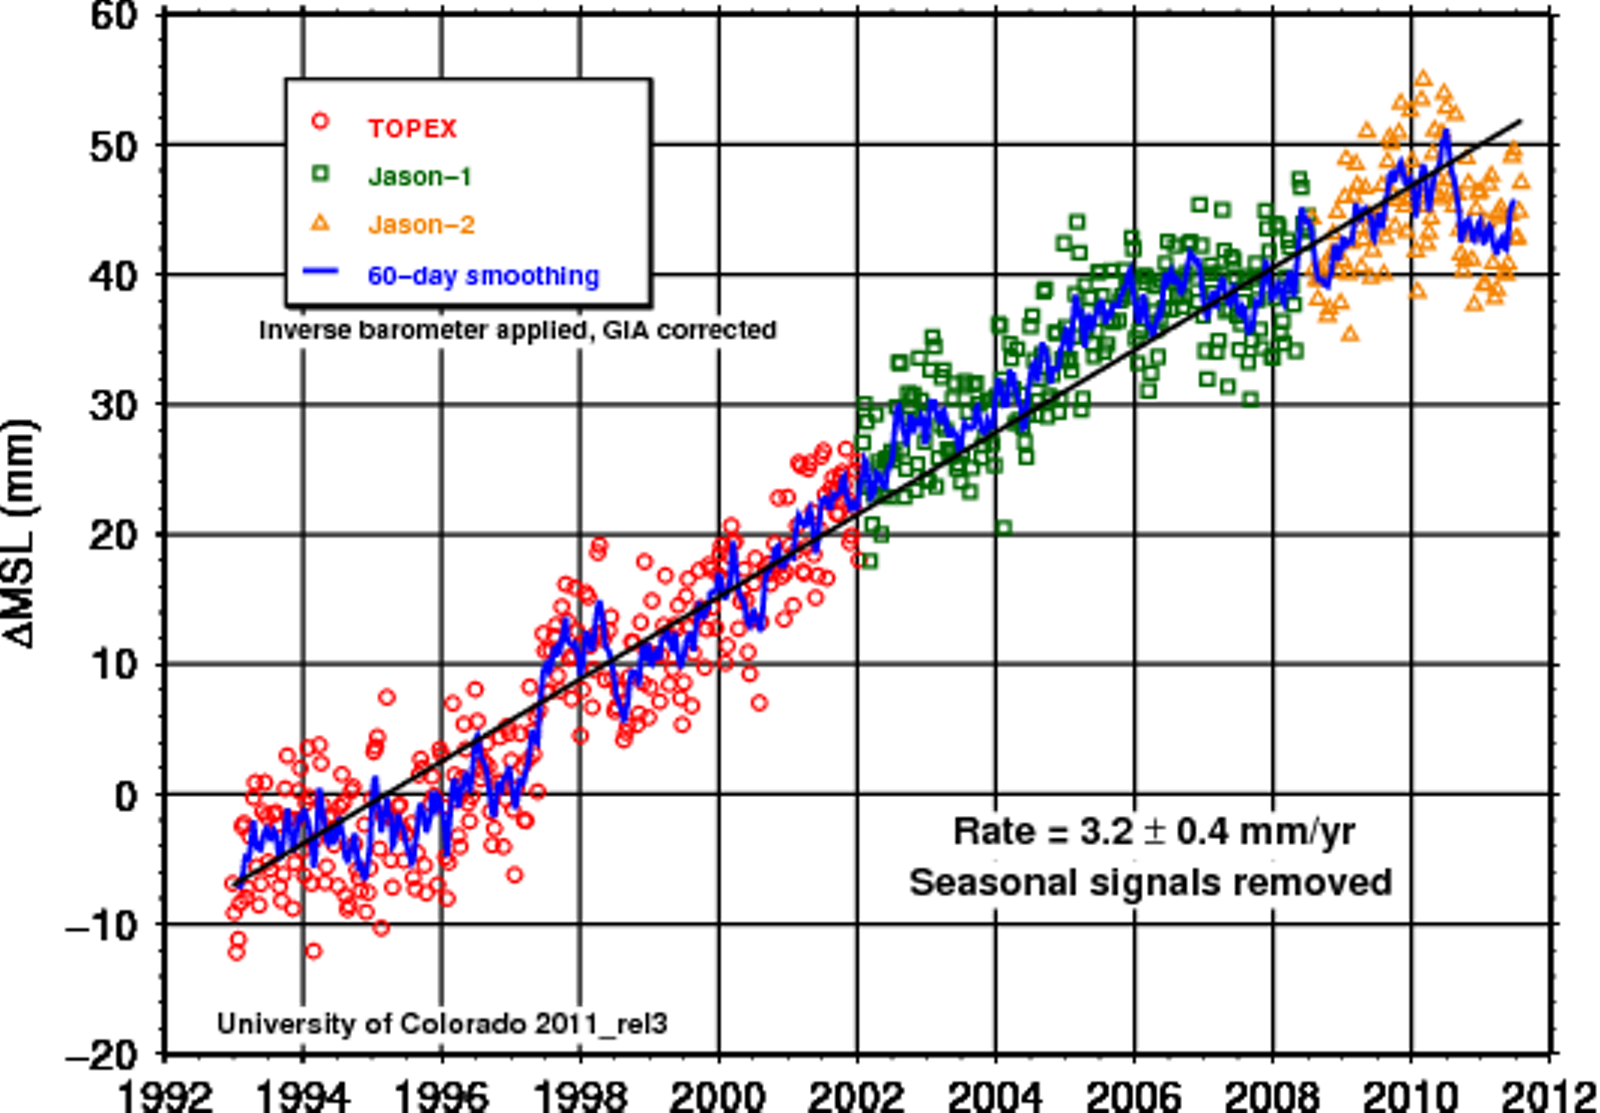
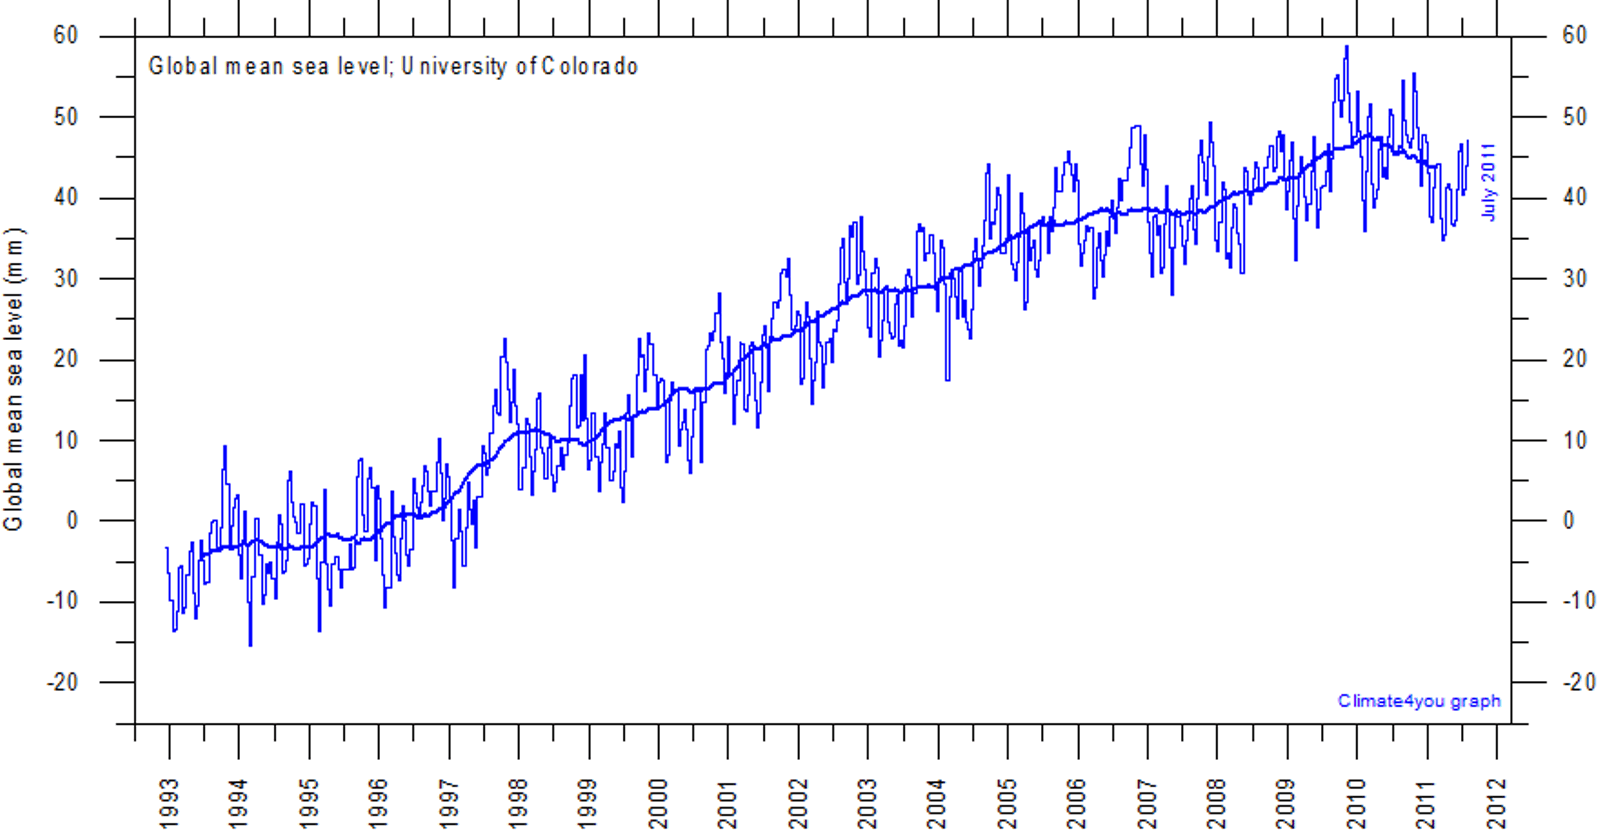
Það kemur auðvitað nokkuð á óvart að sjávarborð skuli hafa lækkað undanfarið, í stað þess að hækka. Sjálfsagt er ekkert óeðlilegt við það og eru þetta bara duttlungar náttúrunnar. Bloggarinn hefur áður fjallað um þessi mál hér og hér fyrir tveim árum og kominn tími til að birta nýjustu mæliniðurstöður. Ekki skulu dregnar neinar ályktanir, en tölurnar tala sínu máli. Myndin hér fyrir ofan er unnin eftir gögnum frá University of Colorado, og fengin að láni frá vefsíðu þeirra. Um er að ræða síðustu gervihnatta-mæligögn sem birt hafa verið opinberlega.
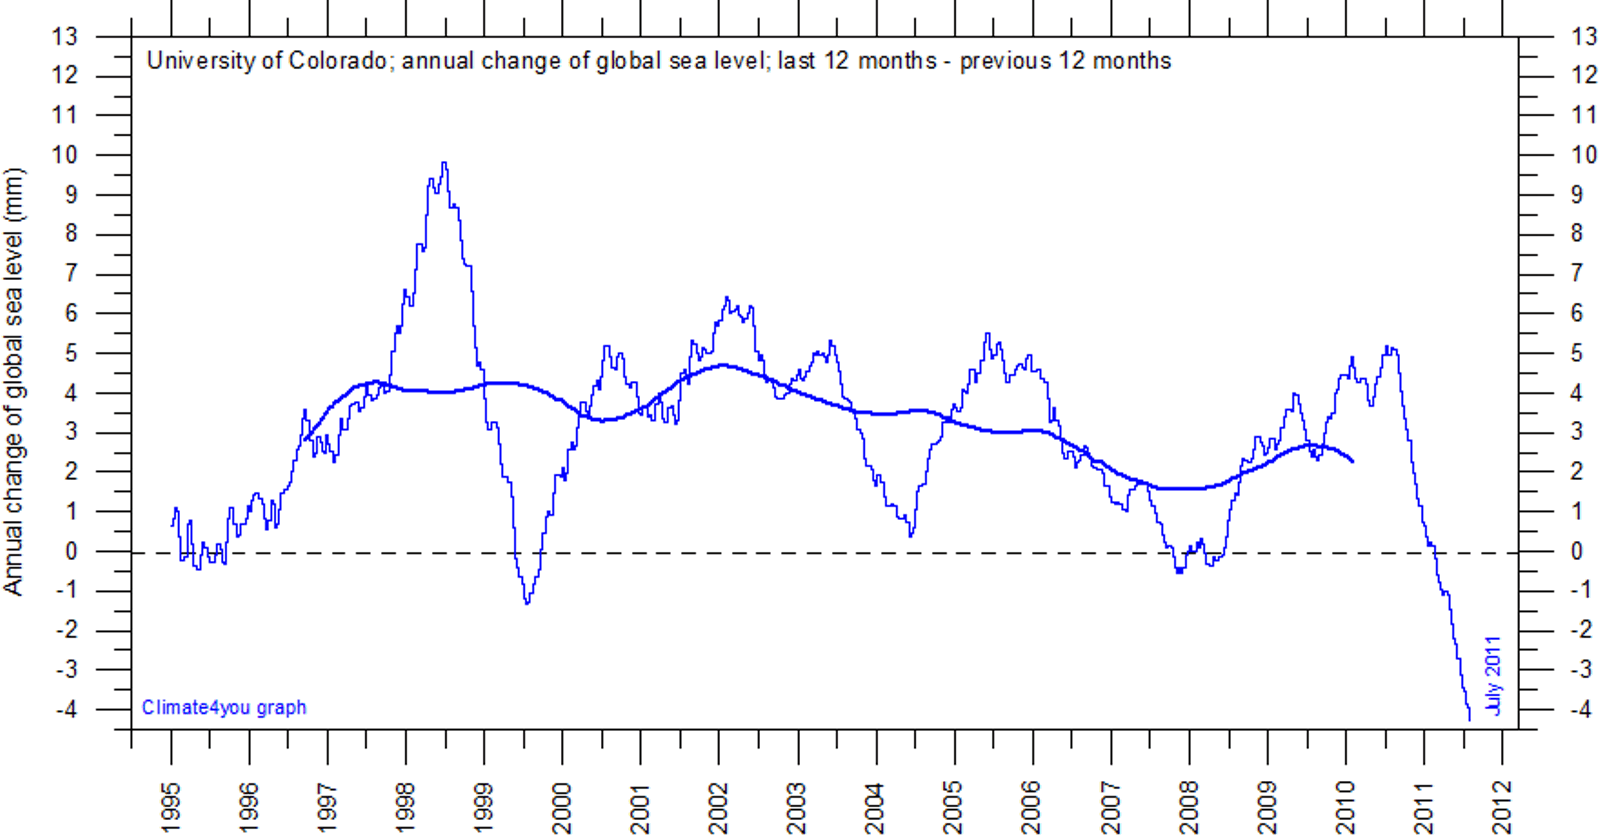
Myndin hér fyrir neðan er unnin úr sömu mæligögnum, en hún sýnir breytinguna frá ári til árs. Við getum látið tölvuna bera saman mælingar milli ára. Fundið mismuninn á sjávarstöðu t.d. fyrir júní í ár og júní í fyrra, maí í ár og maí í fyrra. Koll af kolli, ár fyrir ár. Þannig getum við á einfaldan hátt látið t.d. Excel sýna árlega hækkun (eða lækkun) sjávarborðs í tæpa tvo áratugi. Meðal breytingin (hækkun) yfir allt tímabilið er um 3 mm á ári. Í augnablikinu er þó ferillinn kominn vel niður fyrir núllið, þ.e. töluverð lækkun síðasta árið, sem í augnablikinu nemur 4 mm árlegri lækkun. Ef að líkum lætur, þá á ferillinn eftir að snúa við einhvern tíman. Tíminn einn mun leiða það í ljós.
Takið eftir ferlinum lengst til hægri.
Myndin er fengin af síðunni www.climate4you.com, kaflanum Oceans. Pófessor Ole Humlum við Oslóarháskóla sér um síðuna. Útskýringarnar hér fyrir neðan fylgja myndinni. Menn geta sjálfir sótt frumgögnin og endurtekið teiknun ferlanna með Excel ef þeir vantreysta þessum myndum. Annual change of global sea level since late 1992 according to the Colorado Center for Astrodynamics Research at University of Colorado at Boulder. The data have been prepared by Dr. R. Steven Nerem (nerem@colorado.edu) and Dr. Eric W. Leuliette (leuliett@colorado.edu), and are described by Leuliette et al. (2004). The annual global sea level change is calculated as the difference between the average global sea level the last 12 months and the previous 12 months. The thick line represents the simple running 3 year average. The data shown above include the seasonal signal, and have been prepared using the inverted barometer technique (Inverted Barometer = -9.948 * (1013.3 - global average pressure). The inverted barometer does not have much apparent effect on the global mean sea level because the ocean as a whole is not compressible. Data from the TOPEX/Poseidon mission have been used before 2002, and data from the Jason-1 mission (satellite launched December 2001) after 2002. Time is shown along the x-axis as fractions of calendar years. Last diagram update: 9 October 2011.
The 12-month global sea level change display significant variations over an aproximate 4 year period. These variations are superimposed on a general falling trend. Overall, since initiation of these satellite measurements, the 12-month sea level rise has decreased from about 4 mm/yr to about 3 mm/yr.
Hér er svo mynd frá sömu vefsíðu sem er sambærileg myndinni sem er efst á síðunni:
Breyting á sjávarstöðu undanfarna tvo áratugi. Ferillinn er farinn að sveigja niðurávið lengst til hægri. |
Sjá Wikipedia: Current Sea level Rise. Þar má sjá ferla sem ná yfir lengri tíma.
Vísindi og fræði | Breytt 10.10.2011 kl. 15:52 | Slóð | Facebook | Athugasemdir (8)
Um bloggið
Ginnungagap
Ýmislegt
Loftslag
Teljari
Álverð
Sólin í dag:
(Smella á mynd)
.
Olíuverðið í dag:
Nýjustu færslur
- Kínverskur loftbelgur yfir Ameríku, og Amerískur belgur yfir ...
- Vísindavefurinn: Getum við seinkað klukkunni á Íslandi og fen...
- Sjálfstæðisflokkurinn með tæplega 19% meira fylgi en Samfylki...
- Bjarni Sigurðsson harmonikkusnillingur frá Geysi. Fáein orð...
- Hvers vegna valdi Apple ekki Ísland fyrir gagnaver...?
Heimsóknir
Flettingar
- Í dag (5.7.): 15
- Sl. sólarhring: 19
- Sl. viku: 116
- Frá upphafi: 767721
Annað
- Innlit í dag: 11
- Innlit sl. viku: 85
- Gestir í dag: 11
- IP-tölur í dag: 11
Uppfært á 3 mín. fresti.
Skýringar
Tenglar
Tenglar
Ýmsar vefsíður
- Efnisyfirlit pistla
- Lofthiti - Sjávarstaða - Hafís - Sólvirkni... Beintengdir ferlar
- Club du Soleil Greinar um samaspil sólar og veðurfars
- Stjörnufræðivefurinn
- Astronomy Picture of the Day
- Climate4you
- Watts Up With That?
- World Climate Report
- CO2 Science
- The Reference Frame
- Climate-Audit
- ICECAP
- The Air Went
- Science Sceptical Blog
- Roy Spencer
- Friends of Sience
- Prometheus
- Öldur aldanna. Sjaldan er ein báran stök - einnig í veðurfari? (2003) Vefsíða ÁHB
- Gróðurhúsaáhrif eða eðlilegar sveiflur í virkni sólar? (Grein í Lesbók Mbl. 20. júní 1998) Höfundur Ágúst H. Bjarnason
- Er jörðin að hitna?-Ekki er allt sem sýnist (1998) Vefsíða ÁHB
Uppskriftir
Ýmsar mataruppskriftir
Myndaalbúm
Bloggvinir
-
 majab
majab
-
 ragu
ragu
-
 amadeus
-
 andres08
-
 apalsson
-
 asabjorg
-
 askja
askja
-
 astromix
-
 baldher
-
 biggibraga
-
 bjarkib
-
 bjarnijonsson
-
 bjarnimax
-
 bjorn-geir
-
 blindur
-
 bofs
bofs
-
 brandarar
-
 daliaa
-
 darwin
-
 duddi9
-
 ea
ea
-
 egillsv
-
 einari
-
 einarstrand
-
 elinora
-
 elvira
-
 emilhannes
-
 esv
esv
-
 eyjapeyji
-
 fhg
fhg
-
 finder
-
 finnur
-
 fjarki
-
 flinston
-
 frisk
frisk
-
 gattin
-
 geiragustsson
-
 gillimann
-
 gretaro
-
 gthg
gthg
-
 gudmbjo
-
 gudni-is
-
 gummibraga
-
 gun
gun
-
 gutti
gutti
-
 haddi9001
-
 halldorjonsson
-
 halldors
-
 hlini
hlini
-
 hof
hof
-
 hordurhalldorsson
-
 hreinsamviska
-
 hronnsig
-
 hugdettan
-
 icekeiko
-
 ingibjorgelsa
-
 jakobbjornsson
-
 jakobk
-
 johannesthor
-
 johnnyboy99
-
 jonaa
jonaa
-
 jonasgunnar
-
 jonmagnusson
-
 jonpallv
-
 jonthorolafsson
-
 juliusvalsson
-
 karljg
-
 katrinsnaeholm
-
 kikka
kikka
-
 kje
kje
-
 klarak
-
 kolbrunb
-
 krissiblo
-
 ksh
ksh
-
 kt
kt
-
 lehamzdr
-
 liljabolla
-
 lillagud
-
 lindalea
-
 lucas
lucas
-
 maeglika
-
 maggij
-
 maggiraggi
-
 marinomm
-
 martasmarta
-
 marzibil
-
 mberg
mberg
-
 midborg
-
 minos
minos
-
 morgunbladid
-
 mosi
mosi
-
 mullis
-
 naflaskodun
-
 nimbus
-
 nosejob
-
 omarbjarki
-
 ormurormur
-
 palmig
-
 perlaoghvolparnir
-
 peturmikli
-
 photo
photo
-
 possi
possi
-
 prakkarinn
-
 raggibjarna
-
 rattati
-
 ravenyonaz
-
 redlion
-
 rs1600
-
 rynir
rynir
-
 saemi7
-
 sesseljamaria
-
 sigfus
-
 sigurgeirorri
-
 sjalfstaedi
-
 sjerasigvaldi
-
 skari60
-
 skulablogg
-
 sleggjudomarinn
-
 stebbix
-
 steinibriem
-
 steinnhaf
-
 stinajohanns
-
 stjornuskodun
-
 storibjor
-
 straitjacket
-
 summi
summi
-
 tannibowie
-
 thil
thil
-
 thjodarskutan
-
 throsturg
-
 toro
toro
-
 tryggvigunnarhansen
-
 valdimarjohannesson
-
 valdinn
-
 vefritid
-
 vey
vey
-
 vidhorf
-
 vig
vig
-
 visindin
-
 vulkan
-
 kristjan9
-
 arkimedes
-
 kliddi
-
 eliasbe
Eldri færslur
- Febrúar 2023
- Janúar 2019
- Maí 2018
- Júlí 2017
- Maí 2017
- Febrúar 2017
- Janúar 2017
- Nóvember 2016
- Október 2016
- September 2016
- Júlí 2016
- Apríl 2016
- Mars 2016
- Febrúar 2016
- Janúar 2016
- Desember 2015
- Nóvember 2015
- Október 2015
- Ágúst 2015
- Júní 2015
- Maí 2015
- Apríl 2015
- Mars 2015
- Febrúar 2015
- Janúar 2015
- Desember 2014
- Nóvember 2014
- Október 2014
- September 2014
- Ágúst 2014
- Júlí 2014
- Júní 2014
- Maí 2014
- Apríl 2014
- Mars 2014
- Febrúar 2014
- Janúar 2014
- Desember 2013
- Nóvember 2013
- Október 2013
- September 2013
- Ágúst 2013
- Júlí 2013
- Júní 2013
- Maí 2013
- Apríl 2013
- Mars 2013
- Febrúar 2013
- Janúar 2013
- Desember 2012
- Nóvember 2012
- September 2012
- Ágúst 2012
- Júlí 2012
- Júní 2012
- Maí 2012
- Apríl 2012
- Mars 2012
- Febrúar 2012
- Janúar 2012
- Desember 2011
- Nóvember 2011
- Október 2011
- September 2011
- Ágúst 2011
- Júlí 2011
- Júní 2011
- Apríl 2011
- Mars 2011
- Febrúar 2011
- Janúar 2011
- Desember 2010
- Nóvember 2010
- Október 2010
- September 2010
- Ágúst 2010
- Júlí 2010
- Júní 2010
- Maí 2010
- Apríl 2010
- Mars 2010
- Febrúar 2010
- Janúar 2010
- Desember 2009
- Nóvember 2009
- Október 2009
- September 2009
- Ágúst 2009
- Júlí 2009
- Júní 2009
- Maí 2009
- Apríl 2009
- Mars 2009
- Febrúar 2009
- Janúar 2009
- Desember 2008
- Nóvember 2008
- Október 2008
- September 2008
- Ágúst 2008
- Júlí 2008
- Júní 2008
- Maí 2008
- Apríl 2008
- Mars 2008
- Febrúar 2008
- Janúar 2008
- Desember 2007
- Nóvember 2007
- Október 2007
- September 2007
- Ágúst 2007
- Júlí 2007
- Júní 2007
- Apríl 2007
- Mars 2007
- Febrúar 2007
- Janúar 2007
- Desember 2006
- Nóvember 2006
- Október 2006
- September 2006
Færsluflokkar
- Bloggar
- Bækur
- Dægurmál
- Evrópumál
- Ferðalög
- Fjármál
- Fjölmiðlar
- Heilbrigðismál
- Heimspeki
- Íþróttir
- Kjaramál
- Kvikmyndir
- Lífstíll
- Ljóð
- Löggæsla
- Mannréttindi
- Matur og drykkur
- Menning og listir
- Menntun og skóli
- Samgöngur
- Sjónvarp
- Spaugilegt
- Spil og leikir
- Stjórnmál og samfélag
- Sveitarstjórnarkosningar
- Tónlist
- Trúmál
- Trúmál og siðferði
- Tölvur og tækni
- Umhverfismál
- Utanríkismál/alþjóðamál
- Vefurinn
- Viðskipti og fjármál
- Vinir og fjölskylda
- Vísindi og fræði
