Færsluflokkur: Heimspeki
Sunnudagur, 18. janúar 2015
Deilt um keisarans skegg: Skekkjureikningar og loftslagsmálin...
Smávegis um keisarans skegg: Þegar bloggarinn var í menntaskóla og síðar háskóla var ávallt lögð mikil áhersla á að nemendur framkvæmdu skekkjumat og skekkjureikninga og gerðu grein fyrir óvissumörkum. Það þarf að taka tillit til nákvæmni þeirra mælitækja sem notuð hafa verið, og atriða eins og aflestrarskekkju o.fl. Mat á skekkjuvöldum getur verið dálítið flókið stundum og þurfa menn að vera gagnrýnir, heiðarlegir og skilja hvað þeir eru að fást við. Gera þarf greinarmun á tilviljanakenndum skekkjum og kerfisbundnum. Nota þarf réttar viðurkenndar aðferðir við skekkjumat og úrvinnslu. Allt hefur þetta áhrif á gæði mæligagnanna og niðurstöður, og er nauðsynlegt að gera grein fyrir slíku þegar mæligögn eru birt. Því miður virðist það þó vera orðin algjör undantekning. Í menntaskóla og háskóla fengu menn eðlisfræðiskýrslurnar í hausinn aftur ef réttir skekkjumatsreikningar voru ekki framkvæmdir og niðurstöður túlkaðar samkvæmt því. Það er nauðsynlegt að vita og setja fram óvissubilið eða skekkjumörkin ásamt mæligögnum. Þetta verður alltaf að gera þegar vísindagögn eru birt, því annars eru þau markleysa. Smá dæmi: Hugsum okkur tvær færslur í gagnagrunninum fyrir hitafrávik: Fyrra gildið getur þá verið einhvers staðar á bilinu 0,2° til 0,4° og seinna gildið á bilinu 0,3° til 0,5° vegna óvissumarkanna.
Hugsum okkur enn annað dæmi og aftur tvær færslur í gagnagrunninum fyrir hitafrávik: Skoðum nú gamla ferilinn hjá bresku veðurstofunni Met Office, þar sem menn kunna til verka og sýna hitaferla á réttan hátt með óvissumörkum. (Við erum eingöngu að skoða framsetninguna á myndinni og því skiptir ekki máli þó hún sé ársgömul, - smella á mynd til að stækka):
Við sjáum að skekkjumörk ársmeðaltala síðustu ára eru +/-0,1 en nokkrar mælingar frá 19. öld eru með tvöfalt víðari skekkjumörkum, eða +/-0,2°. Þetta er ekki óeðlilegt. Framsetningin er til fyrirmyndar. Þrátt fyrir þessa óvissu leyfa margir sér kinnroðalaust að bera saman meðalhita ára þar sem munurinn er aðeins 0.01°, eða tífalt minni en óvissumörkin. Auðvitað ættu menn að vera aðeins rjóðir og feimnir þegar þeir ræða málin á þessum nótum, að minnsta kosti ef þeir kunna sín fræði. Þeim sem ekki skilja hvað liggur að baki svona tölum er vorkun og hlýtur að fyrirgefast
Fréttir um heitasta árið og skeggbroddar keisarans: Þar er þessi tafla sem sýnir „topp tíu árin“: Röð, Ár, Frávik, Óvissumörk 1) 2014 0.596 +/- 0.049 (eða +/-0,05) Eins og við sjáum, þá er munurinn milli áranna 2014 og 2010 ekki mikill, eða 0,596 – 0,586=0,01 gráða Celcius. Óvissumörkin eru aftur á móti +/-0,05 fyrir hvort árið um sig, eða 5 sinnum meiri en hitamunurinn. Óvissan er sem sagt tíu sinnum meiri en mismunurinn. (Uppfært 21. janúar 2014: Helgi Sigvaldason verkfræðingur, sem er mjög vel að sér í tölfræði og kenndi bloggaranum fyrir löngu við HÍ, hafði samband og benti á að ég væri aðeins ónákvæmur. Helgi skrifaði meðal annars:
Munurinn á árunum 2010 og 2005 er ennþá minni, eða nánast enginn (0,001 gráða eða 1/1000 úr gráðu). Þetta er ástæðan fyrir því að í skýrslunni frá Berkley stendur eftirfarandi (Þeir nota reyndar skekkjumörkin +/-0,05 í stað +/-0,1 sem breytir ekki niðurstöðunni): „Discussion: The margin of uncertainty we achieved was remarkably small (0.05 C with 95% confidence). This was achieved this, in part, by the inclusion of data from over 30,000 temperature stations, and by the use of optiized statistical methods. Even so, the highest year could not be distinguished. That is, of course, an indication that the Earth s average temperature for the last decade has changed very little. Note that the ten warmest years all occur since 1998“.
Sem sagt: Ekki er hægt að segja að árið 2014 hafi verið það hlýjasta því munurinn á árunum 2014, 2010 og 2005 er tölfræðilega ómarktækur. Samkvæmt þessu eru þessi þrjú ár tölfræðilega jafn hlý og skipa saman efsta sætið. Meðalhiti jarðar hefur breyst mjög lítið síðasta áratug. Sjá um Berkley-Earth verkefnið hér: http://www.berkeleyearth.org
Niðurstaða um keisarans skegg: það verður að fara ósköp varlega þegar meðalhiti tveggja ára er borinn saman. Við verðum að gæta þess að fullyrða ekki of mikið og hafa fyrirvara á því sem við segjum eða skrifum og vísa í skekkjumörk. Við megum ekki vera að deila um keisarans litlu skeggbrodda eins og jafnvel NASA varð á að gera í nýlegri frétt á síðu þeirra, og virðist sem þeir hafi gleymt því sem þeir lærðu í framhaldsskóla um skekkjumat og framsetningu mæligagna.
Smá æfing: Hver er munurinn á 1. árinu og 10. árinu í Berkley-Earth töflunni? Prófum:
Ítarefni:
Um skekkjumat í mælingum: Góður texti frá Menntaskólanum á Akureyri (Word skjal).
--- --- ---Uppfært 21. janúar 2014:
|


|
Jörðin hlýnar áfram |
| Tilkynna um óviðeigandi tengingu við frétt | |
 verkleg_edlisfraedi-thorsteinn_egilsson.doc
 Heimspeki | Breytt 6.8.2019 kl. 13:53 | Slóð | Facebook | Athugasemdir (14)
Þriðjudagur, 21. janúar 2014
Það eru ekki bara fáeinir sérvitringar sem áhuga hafa á samspili sólar og loftslagi jarðar...

Af einhverjum ástæðum virðist sem margir telji að hægt sé að telja vísindagreinar um samspil sólar og loftslags á fingrum annarrar handar. Svo er alls ekki.
Til þæginda fyrir þá sem hafa þá skoðun að breytingar í sólinni hafi áhrif á loftslag jarðar, eða bara til þess að sýna hvert umfang rannsókna á þessum málum er, þá er hér fyrir neðan listi yfir vísindagreinar sem birst hafa frá árinu 2010 um þau fræði. Listinn er ættaður frá Club du Soleil og er á vef Queens University Belfast.
Þetta er þó aðeins listi frá árinu 2010... Nennir einhver að telja greinarnar?
Fyrst má benda á ársgamlan pistil: NASA / NRC: Áhrif sólar á loftslag jarðar geta verið meiri og flóknari en áður var talið...
Og síðan sakar ekki að benda á hvernig rannsóknir benda til að sólvirknin hafi breyst síðastliðin 400 ár:  Útgeislun sólar frá 1610 samkvæmt rannsóknum Dr. Judith Lean Takið eftir Maunder lágmarkinu um það bil 1650-1710 á kaldasta tímabili Litlu ísaldarinnar og Daltom lágmarkinu um 1810, en þá var einnig svalt. http://www.geo.fu-berlin.de/en/met/ag/strat/forschung/SOLARIS/Input_data/Lean2001.pdf http://www.agci.org/docs/lean.pdf
Reyndar á ég ekki von á að nokkur nenni að lesa allt það sem hér fer á eftir, en umfang listans gefur til kynna að þessi áhrifaþáttur á loftslag jarðar er ekki vanmetinn af öllum.
Myndin efst á síðunni eru af sólinni í dag. Skrunið alla leið niður að enda síðunnar, því þar eru allmargar fallegar rauntímamyndir af okkar dagstjörnu.
Vísindagreinar frá árinu 2013The effects of solar irradiation changes on the migration of the Congo Air Boundary and water levels of paleo-Lake Suguta, Northern Kenya Rift, during the African Humid Period (15-5 ka BP)Junginger et al. 2014 Palaeogeography, Palaeoclimatology, PalaeoecologyThe water-level record from the 300 m deep paleo-lake Suguta (Northern Kenya Rift) during the African Humid Period (AHP, 15-5 ka BP) helps to explain decadal to centennial intensity variations in the West African Monsoon (WAM) and the Indian Summer Monsoon (ISM). This water-level record was derived from three different sources: (1) grainsize variations in radiocarbon dated and Rreservoir corrected lacustrine sediments, (2) the altitudes and ages of paleo-shorelines within the basin, and (3) the results of hydro-balance modeling, providing S important insights into the character of water level variations (abrupt or gradual) in the amplifier paleo-Lake Suguta. The results of this comprehensive analyses suggest that the AHP N highstand in the Suguta Valley was the direct consequence of a northeastwards shift in the Congo Air Boundary (CAB), which was in turn caused by an enhanced atmospheric pressure gradient between East Africa and India during a northern hemisphere insolation maximum. Rapidly decreasing water levels of up to 90 m over less than a hundred years are best explained by changes in solar irradiation either reducing the East African-Indian atmospheric pressure P gradient and preventing the CAB from reaching the study area, or reducing the overall humidity in the atmosphere, or a combination of both these effects. In contrast, although not well documented C in our record we hypothesize a gradual end of the AHP despite an abrupt change in the source of precipitation when a decreasing pressure gradient between Asia and Africa prevented the CAB from reaching the Suguta Valley. The abruptness was probably buffered by a contemporaneous change in precession producing an insolation maximum at the equator during October. Whether or not this is the case, the water-level record from the Suguta Valley demonstrates the importance of both orbitally-controlled insolation variations and short-term changes in solar irradiation as factors affecting the significant water level variations in East African rift lakes. Clouds blown by the solar windVoiculescu et al. 2013 Environ. Res. Lett. 8, 045032In this letter we investigate possible relationships between the cloud cover (CC) and the interplanetary electric field (IEF), which is modulated by the solar wind speed and the interplanetary magnetic field. We show that CC at mid-high latitudes systematically correlates with positive IEF, which has a clear energetic input into the atmosphere, but not with negative IEF, in general agreement with predictions of the global electric circuit (GEC)-related mechanism. Thus, our results suggest that mid-high latitude clouds might be affected by the solar wind via the GEC. Since IEF responds differently to solar activity than, for instance, cosmic ray flux or solar irradiance, we also show that such a study allows distinguishing one solar-driven mechanism of cloud evolution, via the GEC, from others. Global warming and solar anomalyChakrabarty and Peshin 2013 Indian Journal of Radio & Space PhysicsDuring 2002-2008, there was no increase in global temperature, though green house gas concentrations had increased. Sun is the ultimate source of energy. It has been, therefore, examined if there was any anomaly in the solar characteristics during this period. The sunspot number data has been used for this purpose. This parameter has an 11-year solar activity cycle and the same is found in the global temperature. But the trend in sun's output, after removing solar activity effect, does not match with the long term trend of global temperature. Peculiarities in the duration and in the peak value of solar cycle 23 were identified which might have portended the increase of global temperature during 2002-2008. The possibility of the pause of increase in temperature could also be that the heat generated due to the increase in the greenhouse gas concentration was absorbed in deep ocean layer. Small influence of solar variability on climate over the past millenniumSchurer et al. 2013 Nature GeoscienceThe climate of the past millennium was marked by substantial decadal and centennial scale variability in the Northern Hemisphere. Low solar activity has been linked to cooling during the Little Ice Age (AD 1450-1850) and there may have been solar forcing of regional warmth during the Medieval Climate Anomaly (AD 950-1250). The amplitude of the associated changes is, however, poorly constrained, with estimates of solar forcing spanning almost an order of magnitude. Numerical simulations tentatively indicate that a small amplitude best agrees with available temperature reconstructions. Here we compare the climatic fingerprints of high and low solar forcing derived from model simulations with an ensemble of surface air temperature reconstructions for the past millennium. Our methodology also accounts for internal climate variability and other external drivers such as volcanic eruptions, as well as uncertainties in the proxy reconstructions and model output. We find that neither a high magnitude of solar forcing nor a strong climate effect of that forcing agree with the temperature reconstructions. We instead conclude that solar forcing probably had a minor effect on Northern Hemisphere climate over the past 1,000 years, while, volcanic eruptions and changes in greenhouse gas concentrations seem to be the most important influence over this period. Deep Solar Activity Minima, Sharp Climate Changes, and Their Impact on Ancient CivilizationsRaspopov et al. 2013 Geomagnetism and Aeronomy 53, 917-92It is shown that, over the past c. 10000 years (the Holocene), deep Maunder type solar minima have been accompanied by sharp climate changes. These minima occurred every 2300-2400 years. It has been established experimentally that, at ca 4.0 ka BP, there occurred a global change in the structure of atmospheric circulation, which coincided in time with the discharge of glacial masses from Greenland to North Atlantic and a solar activity minimum. The climate changes that took place at ca 4.0 ka BP and the deep solar activity minimum that occurred at ca 2.5 ka BP affected the development of human society, leading to the degradation and destruction of a number of ancient civilizations. Late Holocene ecohydrological and carbon dynamics of a UK raised bog: impact of human activity and climate changeTurner et al. 2014 Quaternary Science ReviewsUnderstanding the ecohydrological responses of peatlands to climate change is particularly challenging over the late Holocene owing to the confounding influence of anthropogenic activity. To address this, a core spanning the last c. 2400 years from a raised bog in northern England was analysed using a comprehensive suite of proxy methods in an attempt to elucidate the drivers of change. A testate amoebae-based transfer function was used to quantitatively reconstruct changes in water table depth, supported by humification analysis and a plant macrofossil-derived hydroclimatic index. Pollen and plant macrofossil data were used to examine regional and local vegetation change, and human impacts were inferred from charcoal and geochemistry. Chronological control was achieved through a Bayesian age-depth model based on AMS radiocarbon dates and spheroidal carbonaceous particles, from which peat and carbon accumulation rates were calculated. Phases of both increased and decreased bog surface wetness (inferred effective precipitation) are present, with dry phases at c. AD 320-830, AD 920-1190 and AD 1850-present, and a marked period of increased effective precipitation at c. AD 1460-1850. Coherence with other records from across Northern Europe suggests that these episodes are primarily driven by allogenic climatic change. Periods of high bog surface wetness correspond to the Wolf, Sporer and Maunder sunspot activity minima, suggesting solar forcing was a significant driver of climate change over the last c. 1000 years. Following the intensification of agriculture and industry over the last two centuries, the combined climatic and anthropogenic forcing effects become increasingly difficult to separate due to increases in atmospheric deposition of anthropogenically derived pollutants, fertilising compounds, and additions of wind-blown soil dust. We illustrate the need for multiproxy approaches based on high-resolution palaeoecology and geochemistry to examine the recent trajectories of peatlands. The role of the oceans in shaping the tropospheric response to the 11 year solar cycleMisios and Schmidt 2014 Geophysical Research LettersObservational data indicate a weakening and poleward shift of the subtropical tropospheric jets in the maximum phase of the 11 year solar cycle, commonly explained in terms of a direct "top-down" propagation of solar signals from the stratosphere to the troposphere. We here demonstrate possible linkages to oceanic variability, instead. The observed response of the jets is qualitatively and quantitatively reproduced in an ensemble of simulations with a global model forced only at the lower boundary by the observed sea surface temperatures and sea ice concentrations, while keeping solar cycle forcing constant. The twentieth century reanalysis, in which only surface observations are assimilated, is characterized by a similar shift of the jets. These findings suggest that changes at the ocean surface could contribute considerably to the poleward shift of the subtropical tropospheric jets, although a top-down influence on the oceans and hence indirectly on the jets cannot be excluded. A lagged response to the 11 year solar cycle in observed winter Atlantic/European weather patternsGray et al. 2014 Journal of Geophysical Research: AtmospheresThe surface response to 11 year solar cycle variations is investigated by analyzing the long-term mean sea level pressure and sea surface temperature observations for the period 1870-2010. The analysis reveals a statistically significant 11 year solar signal over Europe, and the North Atlantic provided that the data are lagged by a few years. The delayed signal resembles the positive phase of the North Atlantic Oscillation (NAO) following a solar maximum. The corresponding sea surface temperature response is consistent with this. A similar analysis is performed on long-term climate simulations from a coupled ocean-atmosphere version of the Hadley Centre model that has an extended upper lid so that influences of solar variability via the stratosphere are well resolved. The model reproduces the positive NAO signal over the Atlantic/European sector, but the lag of the surface response is not well reproduced. Possible mechanisms for the lagged nature of the observed response are discussed. Reviewing the effect of CO2 and the sun on global climateFlorides et al. 2013 Renewable and Sustainable Energy ReviewsThis paper discusses the effect of the greenhouse phenomenon and CO2 on global climate and suggests that numerical models that lack adequate knowledge of fundamental related factors cannot be used to extract "sound" conclusions. A very basic demonstration of this is done through a simple comparison between estimates of the forecast for global temperature increase obtained by various independent studies. Observing the global temperature and the CO2 atmospheric concentration though the geological aeons implies no obvious correlation. Physical observation on other planets like Mars and Venus, needing no numerical modeling, demonstrates the effect of the atmospheric-CO2 partial pressure on the temperature of the atmosphere. Moreover the CO2 role as a factor of danger or a benefactor for life is also addressed. On the other hand the role of the sun in the presently observed global warming has been greatly underestimated. Scientific evidence shows that the orbit of the earth and the Milankovitch cycles greatly affect the climate. A discussion follows pointing out the prime role that the sun should have on the earth's climate with regard to solar cycles' activity and irradiance, cosmic rays and cloud formation. The conclusion drawn here is that a natural signal of solar forcing has been mistakenly overlooked for an anthropogenic change, maybe owing to their quite similar effects on climate. For the moment science does not really have a complete and total understanding of the factors affecting the earth's complex climate system and therefore no sound conclusions can be drawn. Influence of the Pacific Decadal Oscillation, El Nino-Southern Oscillation and solar forcing on climate and primary productivity changes in the northeast PacificPatterson et al. 2013 Quaternary InternationalEvidence of 11-year Schwabe solar sunspot cycles, El Nino-Southern Oscillation (ENSO) and the Pacific Decadal Oscillation (PDO) were detected in an annual record of diatomaceous laminated sediments from anoxic Effingham Inlet, Vancouver Island, British Columbia. Radiometric dating and counting of annual varves dates the sediments from AD 1947-1993. Intact sediment slabs were X-rayed for sediment structure (lamina thickness and composition based on gray-scale), and subsamples were examined for diatom abundances and for grain size. Wavelet analysis reveals the presence of c. 2-3, 4.5, 7 and 9-12 year cycles in the diatom record and an c. 11-13 year record in the sedimentary varve thickness record. These cycle lengths suggest that both ENSO and the sunspot cycle had an influence on primary productivity and sedimentation patterns. Sediment grain size could not be correlated to the sunspot cycle although a peak in the grain size data centered around the mid-1970s may be related to the 1976-1977 Pacific climate shift, which occurred when the PDO index shifted from negative (cool conditions) to positive (warm conditions). Additional evidence of the PDO regime shift is found in wavelet and cross-wavelet results for Skeletonema costatum, a weakly silicified variant of S. costatum, annual precipitation and April to June precipitation. Higher spring (April/May) values of the North Pacific High pressure index during sunspot minima suggest that during this time, increased cloud cover and concomitant suppression of the Aleutian Low (AL) pressure system led to strengthened coastal upwelling and enhanced diatom production earlier in the year. These results suggest that the 11-year solar cycle, amplified by cloud cover and upwelling changes, as well as ENSO, exert significant influence on marine primary productivity in the northeast Pacific. The expression of these cyclic phenomena in the sedimentary record were in turn modulated by the phase of PDO, as indicated by the change in period of ENSO and suppression of the solar signal in the record after the 1976-1977 regime shift. Prediction of solar activity for the next 500 yearsSteinhilber and Beer 2013 Journal of Geophysical ResearchRecently, a new low-noise record of solar activity has been reconstructed for the past 10 149400 years by combining two Be records from Greenland and Antarctica with C from tree rings [Steinhilber et al., 2012]. This record confirms earlier results, namely, that the Sun has varied with distinct periodicities in the past. We present a prediction of mean solar magnetic activity averaged over 22 years for the next 500 years mainly based on the spectral information derived from the solar activity record of the past. Assuming that the Sun will continue to vary with the same periodicities for the next centuries, we extract the spectral information from the past and apply it to two different methods to predict the future of solar magnetic activity. First, the two methods are tested by predicting past changes. Our methods are able to predict periods of high and low solar activities for a few centuries in the past. However, they are less successful in predicting the correct amplitude. Then, the methods were used to predict the period 2000-2500. Both methods predict a period of low activity around 2100 A.D. Between 2100 and 2350 A.D., the results are inconsistent regarding the duration of the low-activity state in 2100 A.D. and the level of activity until 2250 A.D. Around 2250 A.D., both methods predict a period of moderate activity. After 2350 A.D., both methods point to a period of high activity. The period of high activity will end around 2400 A.D. and will be followed by a period of moderate activity. Lengths of Schwabe cycles in the seventh and eighth centuries indicated by precise measurement of carbon-14 content in tree ringsMiyake et al. 2013 Journal of Geophysical ResearchRadiocarbon (14C) is produced in the atmosphere by galactic cosmic rays, which are modulated by solar magnetic activity. Its content in tree rings is retained and provides a record of past cosmic ray intensity and solar activity. We have measured, with 2 year resolution, the 14C content in Japanese cedar tree rings for the period A.D. 600 to 760, which includes a small grand solar minimum in the seventh to eighth centuries. Periodicity analysis of the 14C data shows that there is a component in the frequency band of the Schwabe cycle, with a period of 12-13 years continuing throughout the minimum. This is the fourth case in which an increase in the length of the Schwabe cycle has been observed in a grand solar minimum, after the Maunder Minimum, the Spoerer Minimum, and the Fourth Century B.C. Minimum. Global temperatures and sunspot numbers. Are they related?Gil-Alana et al. 2013 Physica AThis paper deals with the analysis of global temperatures and sunspot numbers and the relationship between the two. We use techniques based on the concept of long range dependence. For the temperatures, the best specification seems to be a fractionally integrated or I(d) model with an order of integration d of about 0.46 and an estimated time trend coefficient that suggests that temperatures have increased by about 0.57 C over the last one hundred years. However, for the sunspot numbers, a cyclical fractional model seems to be more appropriate, with a periodicity of 11 years per cycle and an order of integration of about 0.40. Thus, the two series display long memory and fractional integration. However, the fact that both series display poles in the spectrum at different frequencies implies that we fail to reject the null hypothesis of no relationship between the two variables in the long run. Moreover, assuming that the sunspots are exogenous, the results show no statistical significance of this variable on the global temperatures, which is one of the main contributions of the present work. Does the diurnal temperature range respond to changes in the cosmic ray flux?Laken and Calogovic 2013 Environmental Research Letters 8, 045018Recent studies have suggested that measurements of the diurnal temperature range (DTR) over Europe may provide evidence of a long-hypothesized link between the cosmic ray (CR) flux and cloud cover. Such propositions are interesting, as previous investigations of CR-cloud links are limited by data issues including long-term reliability and view-angle artifacts in satellite-based cloud measurements. Consequently, the DTR presents a further independent opportunity for assessment. Claims have been made that during infrequent high-magnitude increases (ground level enhancements, GLE) and decreases (Forbush decreases, Fd) in the CR flux significant anti-correlated DTR changes may be observed, and the magnitude of the DTR deviations increases with the size of the CR disturbance. If confirmed this may have important consequences for the estimation of natural climate forcing. We analyze these claims, and conclude that no statistically significant fluctuations in DTR (p < 0.05) are observed. Using detailed Monte Carlo significance testing we show that past claims to the contrary result from a methodological error in estimating significance connected to the effects of sub-sampling. Terrestrial ground temperature variations in relation to solar magnetic variability, including the present Schwabe cyclede Jager and Nieuwenhuijzen 2013 Natural Science 5, 1112-1120We study the influence of solar activity on climate by investigating the relation between the long-term components of the total magnetic fluxes of both the equatorial and polar fields of the sun and the average terrestrial ground temperature. This is done for the period 1610 (beginning of systematic sunspot observations) till present with an extrapolation to 2015. It is found that from 1610 till about the first half of the 20th century the variation of the long-term average terrestrial ground temperatures is chiefly due to the variation of solar activity, with seemingly random, non-solar residuals. Around 2007, after the Grand Maximum of the 20th century, solar activity, after having gone through a remarkable transition period (c. 2005 to c. 2010), entered into another Grand Episode. That Episode started with the present solar cycle, in shape comparable to the equally weak Schwabe cycle #14. The transition period, in combination with the present low Schwabe cycle causes that the solar contribution to the total terrestrial temperature variation is small during the on-going decade. It results in a slowing down of the rise of temperature after c. 2005. Holocene flood frequency across the Central Alps - solar forcing and evidence for variations in North Atlantic atmospheric circulationWirth et al. 2013 Quaternary Science Reviews 80, 112-128The frequency of large-scale heavy precipitation events in the European Alps is expected to undergo substantial changes with current climate change. Hence, knowledge about the past natural variability of floods caused by heavy precipitation constitutes important input for climate projections. We present a comprehensive Holocene (10,000 years) reconstruction of the flood frequency in the Central European Alps combining 15 lacustrine sediment records. These records provide an extensive catalog of flood deposits, which were generated by flood-induced underflows delivering terrestrial material to the lake floors. The multi-archive approach allows suppressing local weather patterns, such as thunderstorms, from the obtained climate signal. We reconstructed mainly late spring to fall events since ice cover and precipitation in form of snow in winter at high-altitude study sites do inhibit the generation of flood layers. We found that flood frequency was higher during cool periods, coinciding with lows in solar activity. In addition, flood occurrence shows periodicities that are also observed in reconstructions of 14C and 10B solar activity from C and Be records (2500-3000, 900-1200, as well as of about 710, 500, 350, 208 (Suess cycle), 150, 104 and 87 (Gleissberg cycle) years). As atmospheric mechanism, we propose an expansion/shrinking of the Hadley cell with increasing/decreasing air temperature, causing dry/wet conditions in Central Europe during phases of high/low solar activity. Furthermore, differences between the flood patterns from the Northern Alps and the Southern Alps indicate changes in North Atlantic circulation. Enhanced flood occurrence in the South compared to the North suggests a pronounced southward position of the Westerlies and/or blocking over the northern North Atlantic, hence resembling a negative NAO state (most distinct from 4.2 to 2.4 kyr BP and during the Little Ice Age). South-Alpine flood activity therefore provides a qualitative record of variations in a paleo-NAO pattern during the Holocene. Additionally, increased South Alpine flood activity contrasts to low precipitation in tropical Central America (Cariaco Basin) on the Holocene and centennial time scale. This observation is consistent with a Holocene southward migration of the Atlantic circulation system, and hence of the ITCZ, driven by decreasing summer insolation in the Northern hemisphere, as well as with shorter-term fluctuations probably driven by solar activity. Paleoclimate data-model comparison and the role of climate forcings over the past 1500 yearsPhipps et al. 2013 Journal of Climate 26, 6915-6936The past 1500 years provide a valuable opportunity to study the response of the climate system to external forcings. However, the integration of paleoclimate proxies with climate modeling is critical to improving the understanding of climate dynamics. In this paper, a climate system model and proxy records are therefore used to study the role of natural and anthropogenic forcings in driving the global climate. The inverse and forward approaches to paleoclimate data-model comparison are applied, and sources of uncertainty are identified and discussed. In the first of two case studies, the climate model simulations are compared with multiproxy temperature reconstructions. Robust solar and volcanic signals are detected in Southern Hemisphere temperatures, with a possible volcanic signal detected in the Northern Hemisphere. The anthropogenic signal dominates during the industrial period. It is also found that seasonal and geographical biases may cause multiproxy reconstructions to overestimate the magnitude of the long-term preindustrial cooling trend. In the second case study, the model simulations are compared with a coral d18O record from the central Pacific Ocean. It is found that greenhouse gases, solar irradiance, and volcanic eruptions all influence the mean state of the central Pacific, but there is no evidence that natural or anthropogenic forcings have any systematic impact on El Nino-Southern Oscillation. The proxy climate relationship is found to change over time, challenging the assumption of stationarity that underlies the interpretation of paleoclimate proxies. These case studies demonstrate the value of paleoclimate data-model comparison but also highlight the limitations of current techniques and demonstrate the need to develop alternative approaches. Solar forcing of Caribbean drought events during the last millenniumBurn and Palmer 2013 Journal of Quaternary ScienceAnthropogenic climate change is expected to increase the frequency of drought events in the earth's subtropical regions. However, the climate dynamics of these regions are not fully understood and debate surrounds how external forcing factors such as solar and volcanic forcing influence long-term rainfall patterns in the subtropics. Here, we present the first high-resolution reconstruction of Caribbean drought events over the last millennium based on analyses of sediment geochemical data from a continuous high-resolution coastal lake-sediment record in Jamaica. The record suggests extended episodes of drought occurred during the so-called Little Ice Age (1400-1850 CE), which were associated with El-Nino-like conditions in the eastern equatorial Pacific Ocean and controlled by low natural radiative forcing. Comparison of the Jamaican drought record with previously published palaeoclimatic archives from within the circum-Caribbean region suggests that dry conditions were associated with the southward migration of the Hadley Cell, a stronger North Atlantic High and the concomitant intensification of the north-east trade winds and the Caribbean Low Level Jet. We conclude that pre-industrial climatic change in the region was probably controlled by solar forcing and modulated by the combined influence of El Nino Southern Oscillation and the North Atlantic Oscillation. North-south palaeohydrological contrasts in the central Mediterranean during the Holocene: tentative synthesis and working hypothesesMagny et al. 2013 Climate of the Past 9, 2043-2071On the basis of a multi-proxy approach and a strategy combining lacustrine and marine records along a north-south transect, data collected in the central Mediterranean within the framework of a collaborative project have led to reconstruction of high-resolution and well-dated palaeohydrological records and to assessment of their spatial and temporal coherency. Contrasting patterns of palaeohydrological changes have been evidenced in the central Mediterranean: south (north) of around 40N of latitude, the middle part of the Holocene was characterised by lake-level maxima (minima), during an interval dated to ca. 10 300-4500 cal BP to the south and 9000-4500 cal BP to the north. Available data suggest that these contrasting palaeohydrological patterns operated throughout the Holocene, both on millennial and centennial scales. Regarding precipitation seasonality, maximum humidity in the central Mediterranean during the middle part of the Holocene was characterised by humid winters and dry summers north of ca. 40N, and humid winters and summers south of ca. 40N. This may explain an apparent conflict between palaeoclimatic records depending on the proxies used for reconstruction as well as the synchronous expansion of tree species taxa with contrasting climatic requirements. In addition, south of ca. 40N, the first millennium of the Holocene was characterised by very dry climatic conditions not only in the eastern, but also in the central- and the western Mediterranean zones as reflected by low lake levels and delayed reforestation. These results suggest that, in addition to the influence of the Nile discharge reinforced by the African monsoon, the deposition of Sapropel 1 has been favoured (1) by an increase in winter precipitation in the northern Mediterranean borderlands, and (2) by an increase in winter and summer precipitation in the southern Mediterranean area. The climate reversal following the Holocene climate optimum appears to have been punctuated by two major climate changes around 7500 and 4500 cal BP. In the central Mediterranean, the Holocene palaeohydrological changes developed in response to a combination of orbital, ice-sheet and solar forcing factors. The maximum humidity interval in the south-central Mediterranean started ca. 10 300 cal BP, in correlation with the decline (1) of the possible blocking effects of the North Atlantic anticyclone linked to maximum insolation, and/or (2) of the influence of the remnant ice sheets and fresh water forcing in the North Atlantic Ocean. In the north-central Mediterranean, the lake-level minimum interval began only around 9000 cal BP when the Fennoscandian ice sheet disappeared and a prevailing positive NAO-(North Atlantic Oscillation) type circulation developed in the North Atlantic area. The major palaeohydrological oscillation around 4500-4000 cal BP may be a non-linear response to the gradual decrease in insolation, with additional key seasonal and interhemispheric changes. On a centennial scale, the successive climatic events which punctuated the entire Holocene in the central Mediterranean coincided with cooling events associated with deglacial outbursts in the North Atlantic area and decreases in solar activity during the interval 11 700-7000 cal BP, and to a possible combination of NAO-type circulation and solar forcing since ca. 7000 cal BP onwards. Thus, regarding the centennial-scale climatic oscillations, the Mediterranean Basin appears to have been strongly linked to the North Atlantic area and affected by solar activity over the entire Holocene. In addition to model experiments, a better understanding of forcing factors and past atmospheric circulation patterns behind the Holocene palaeohydrological changes in the Mediterranean area will require further investigation to establish additional high-resolution and well-dated records in selected locations around the Mediterranean Basin and in adjacent regions. Special attention should be paid to greater precision in the reconstruction, on millennial and centennial timescales, of changes in the latitudinal location of the limit between the northern and southern palaeohydrological Mediterranean sectors, depending on (1) the intensity and/or characteristics of climatic periods/oscillations (e.g. Holocene thermal maximum versus Neoglacial, as well as, for instance, the 8.2 ka event versus the 4 ka event or the Little Ice Age); and (2) on varying geographical conditions from the western to the eastern Mediterranean areas (longitudinal gradients). Finally, on the basis of projects using strategically located study sites, there is a need to explore possible influences of other general atmospheric circulation patterns than NAO, such as the East Atlantic-West Russian or North Sea-Caspian patterns, in explaining the apparent complexity of palaeoclimatic (palaeohydrological) Holocene records from the Mediterranean area. A reconstruction of radiocarbon production and total solar irradiance from the Holocene 14C and CO2 records: implications of data and model uncertaintiesRoth and Joos 2013 Climate of the Past 9, 1879-1909Radiocarbon production, solar activity, total solar irradiance (TSI) and solar-induced climate change are reconstructed for the Holocene (10 to 0 kyr BP), and TSI is predicted for the next centuries. The IntCal09/SHCal04 radiocarbon and ice core CO2 records, reconstructions of the geomagnetic dipole, and instrumental data of solar activity are applied in the Bern3D-LPJ, a fully featured Earth system model of intermediate complexity including a 3-D dynamic ocean, ocean sediments, and a dynamic vegetation model, and in formulations linking radiocarbon production, the solar modulation potential, and TSI. Uncertainties are assessed using Monte Carlo simulations and bounding scenarios. Transient climate simulations span the past 21 thousand years, thereby considering the time lags and uncertainties associated with the last glacial termination. Our carbon-cycle-based modern estimate of radiocarbon production of 1.7 atoms cm-2 s-1 is lower than previously reported for the cosmogenic nuclide production model by Masarik and Beer (2009) and is more in line with Kovaltsov et al. (2012). In contrast to earlier studies, periods of high solar activity were quite common not only in recent millennia, but throughout the Holocene. Notable deviations compared to earlier reconstructions are also found on decadal to centennial timescales. We show that earlier Holocene reconstructions, not accounting for the interhemispheric gradients in radiocarbon, are biased low. Solar activity is during 28% of the time higher than the modern average (650 MeV), but the absolute values remain weakly constrained due to uncertainties in the normalisation of the solar modulation to instrumental data. A recently published solar activity-TSI relationship yields small changes in Holocene TSI of the order of 1 W m-2 with a Maunder Minimum irradiance reduction of 0.85 +- 0.16 W m-2. Related solar-induced variations in global mean surface air temperature are simulated to be within 0.1 K. Autoregressive modelling suggests a declining trend of solar activity in the 21st century towards average Holocene conditions. Reconstruction and Prediction of Variations in the Open Solar Magnetic Flux and Interplanetary ConditionsLockwood 2013 Living Reviews Solar Physics 10, 4Historic geomagnetic activity observations have been used to reveal centennial variations in the open solar flux and the near-Earth heliospheric conditions (the interplanetary magnetic field and the solar wind speed). The various methods are in very good agreement for the past 135 years when there were sufficient reliable magnetic observatories in operation to eliminate problems due to site-specific errors and calibration drifts. This review underlines the physical principles that allow these reconstructions to be made, as well as the details of the various algorithms employed and the results obtained. Discussion is included of: the importance of the averaging timescale; the key differences between "range" and "interdiurnal variability" geomagnetic data; the need to distinguish source field sector structure from heliospherically-imposed field structure; the importance of ensuring that regressions used are statistically robust; and uncertainty analysis. The reconstructions are exceedingly useful as they provide calibration between the in-situ spacecraft measurements from the past five decades and the millennial records of heliospheric behaviour deduced from measured abundances of cosmogenic radionuclides found in terrestrial reservoirs. Continuity of open solar flux, using sunspot number to quantify the emergence rate, is the basis of a number of models that have been very successful in reproducing the variation derived from geomagnetic activity. These models allow us to extend the reconstructions back to before the development of the magnetometer and to cover the Maunder minimum. Allied to the radionuclide data, the models are revealing much about how the Sun and heliosphere behaved outside of grand solar maxima and are providing a means of predicting how solar activity is likely to evolve now that the recent grand maximum (that had prevailed throughout the space age) has come to an end. Discussion on climate oscillations: CMIP5 general circulation models versus a semi-empirical harmonic model based on astronomical cyclesScafetta 2013 Earth Science ReviewsPower spectra of global surface temperature (GST) records (available since 1850) reveal periodities at about 9.1, 10-11, 19-22 and 59-62 years. Equivalent oscillations are found in numerous multisecular paleoclimatic records. The CMIP5 general circulation models (GCMs), to be used in the 2013 IPCC AR5 report, are analyzed and found not able to reconstruct this variability. In particular, from 2000 to 2013.5 a GST plateau is observed, while the GCMs predicted a warming of about 2 C/century. In contrast, the hypothesis that the climate is regulated by specific natural oscillations better interprets the GST records at multiple time scales. For example, a quasi 60-year natural oscillation explains the 1850-1880, 1910-1940 and 1970-2000 warming periods, the 1880-1910 and 1940-1970 cooling periods and the post 2000 plateau. This hypothesis implies that about 50% of the c. 0.5 C global surface warming observed from 1970 to 2000 was due to natural oscillations of the climate system, not to anthropogenic forcing as modeled by the GCMs. The climate sensitivity to CO2 doubling should be reduced from the claimed 2.0-4.5 C range to 1.0-2.3 C with a likely median of c. 1.5 C instead of c. 3.0 C. Also modern paleoclimatic temperature reconstructions showing a larger preindustrial variability than the hockey-stick shaped temperature reconstructions developed in early 2000 imply a lower anthropogenic effect and a larger solar effect. The observed natural oscillations could be driven by astronomical forcings. The c. 9.1 year oscillation appears to be a combination of long soli-lunar tidal oscillations, while quasi 10-11, 20 and 60 year oscillations are typically found among major solar and heliospheric oscillations driven mostly by Jupiter and Saturn movements. Solar models based on heliospheric oscillations also predict quasi secular (e.g. c. 115 year) and millennial (e.g. c. 983 year) solar oscillations, which hindcast observed climate oscillations during the Holocene. It is proposed a semi-empirical climate model made of six specific astronomical oscillations as constructors of the natural climate variability spanning from the decadal to the millennial scales plus a 50% attenuated radiative warming component deduced from the GCM mean simulation as a measure of the anthropogenic plus volcano effect. The semi-empirical model reconstructs the 1850-2012 climatic patterns significantly better than any CMIP5 GCM simulation. Under the same CMIP5 anthropogenic emission scenarios, the model projects a possible 2000-2100 average warming ranging from about 0.3 C to 1.8 C. This range is significantly below the original CMIP5 GCM ensemble mean projections spanning from about 1 C to 4 C. Future research should better investigate space-climate coupling mechanisms and develop more advanced semi-empirical climate models. HadCRUT3 and HadCRUT4, UAH MSU, RSS MSU, GISS and NCDC temperature reconstructions are analyzed. On the insignificance of Herschel's sunspot correlationLove, 2013 Geophysical Research LettersWe examine William Herschel's hypothesis that solar-cycle variation of the Sun's irradiance has a modulating effect on the Earth's climate, and that this is, specifically, manifest as an anticorrelation between sunspot number and the market price of wheat. Since Herschel first proposed his hypothesis in 1801, it has been regarded with both interest and skepticism. Recently, reports have been published that either support Herschel's hypothesis or rely on its validity. As a test of Herschel's hypothesis, we seek to reject a null hypothesis of a statistically random correlation between historical sunspot numbers, wheat prices in London and the United States, and wheat-farm yields in the United States. We employ binary-correlation, Pearson-correlation, and frequency-domain methods. We test our methods using an historical geomagnetic-activity index, well known to be causally correlated with sunspot number. As expected, the measured correlation between sunspot number and geomagnetic activitywould be an unlikely realization of random data; the correlation is "statistically significant". On the other hand, measured correlations between sunspot number and wheat-price and wheat-yield data would be very likely realizations of random data; these correlations are "insignificant". Therefore, Herschel's hypothesis must be regarded with skepticism. We compare and contrast our results with those of other researchers. We discuss procedures for evaluating hypotheses that are formulated from historical data. The role of the Sun in atmosphere-ocean couplingRoy 2013 International Journal of ClimatologyAn overview of the processes involved in determining the Sun''s influence on climate is presented in the form of a flow chart. Evidence and hypotheses concerning the combined influences of the El Niño-Southern Oscillation, the Quasi-Biennial Oscillation and the Solar Cycle on the Hadley and Walker circulations are discussed in the context of atmosphere-ocean coupling, focussing on the Pacific region. It is shown that the Sun plays a crucial role in ocean-atmosphere coupling but that this coupling appears to be disturbed during the latter half of the 20th century, probably related to climate change. The identification of a solar influence can lead to improved skill in prediction so as to better inform communities to address/mitigate some of the crucial issues that are associated with climate change. Solar and planetary oscillation control on climate change: hind-cast, forecast and a comparison with the CMIP5 GCMsScafetta 2013 Energy and Environment 24, 455-496Global surface temperature records (e.g. HadCRUT4) since 1850 are characterized by climatic oscillations synchronous with specific solar, planetary and lunar harmonics superimposed on a background warming modulation. The latter is related to a long millennial solar oscillation and to changes in the chemical composition of the atmosphere (e.g. aerosol and greenhouse gases). However, current general circulation climate models, e.g. the CMIP5 GCMs, to be used in the AR5 IPCC Report in 2013, fail to reconstruct the observed climatic oscillations. As an alternate, an empirical model is proposed that uses: (1) a specific set of decadal, multidecadal, secular and millennial astronomic harmonics to simulate the observed climatic oscillations; (2) a 0.45 attenuation of the GCM ensemble mean simulations to model the anthropogenic and volcano forcing effects. The proposed empirical model outperforms the GCMs by better hind-casting the observed 1850-2012 climatic patterns. It is found that: (1) about 50-60% of the warming observed since 1850 and since 1970 was induced by natural oscillations likely resulting from harmonic astronomical forcings that are not yet included in the GCMs; (2) a 2000-2040 approximately steady projected temperature; (3) a 2000-2100 projected warming ranging between 0.3 C and 1.6 C, which is significantly lower than the IPCC GCM ensemble mean projected warming of 1.1 oC to 4.1 oC ; (4) an equilibrium climate sensitivity to CO2 doubling centered in 1.35 oC and varying between 0.9 oC and 2.0 oC. IPCC underestimates the sun's role in climate changevan Geel and Ziegler 2013 Energy and Environment 24, 431-453For the understanding of current and future climate change it is a basic pre requisite to properly understand the mechanisms, which controlled climate change after the Last Ice Age. According to the IPCC 5th assessment report (in prep.) the Sun has not been a major driver of climate change during the post-Little Ice Age slow warming, and particularly not during the last 40 years. This statement requires critical review as the IPCC neglects strong paleo-climatologic evidence for the high sensitivity of the climate system to changes in solar activity. This high climate sensitivity is not alone due to variations in total solar irradiance-related direct solar forcing, but also due to additional, so-called indirect solar forcings. These include solar-related chemical-based UV irradiance-related variations in stratospheric temperatures and galactic cosmic ray-related changes in cloud cover and surface temperatures, as well as ocean oscillations, such as the Pacific Decadal Oscillation and the North Atlantic Oscillation that significant affect the climate. As it is still difficult to quantify the relative contribution of combined direct and indirect solar forcing and of increased atmospheric CO2 concentrations to the slow warming of the last 40 years, predictions about future global warming based exclusively on anthropogenic CO2 emission scenarios are premature. Nevertheless, the cyclical temperature increase of the 20th century coincided with the buildup and culmination of the Grand Solar Maximum that commenced in 1924 and ended in 2008. The anticipated phase of declining solar activity of the coming decades will be a welcome "natural laboratory" to clarify and quantify the present and future role of solar variation in climate change. Impact of a potential 21st century "grand solar minimum" on surface temperatures and stratospheric ozoneAnet et al. 2013 Geophysical Research LettersWe investigate the effects of a recently proposed 21st century Dalton-minimum-like decline of solar activity on the evolution of Earths' climate and ozone layer. Three sets of 2-member ensemble simulations, radiatively forced by a mid-level emission scenario (IPCC RCP4.5), are performed with the atmosphere-ocean chemistry climate model AOCCM SOCOL3-MPIOM, one with constant solar activity, the other two with reduced solar activity and different strength of the solar irradiance forcing. A future grand solar minimum will reduce the global mean surface warming of 2K between 1986-2005 and 2081-2100 by 0.2 to 0.3 K. Furthermore, the decrease in solar UV radiation leads to a significant delay of stratospheric ozone recovery by 10 years and longer. Therefore, the effects of a solar activity minimum, should it occur, may interfere with international efforts for the protection of global climate and the ozone layer. A Holocene paleoclimate reconstruction for eastern Canada based on d18O cellulose of Sphagnum mosses from Mer Bleue BogEl Bilali et al. 2013 The HoloceneWe present a c. 9200 yr high-resolution oxygen isotope record of plant cellulose (d18Ocel) from the peat deposits of Mer Bleue Bog, Ontario and apply it as a proxy for paleotemperature reconstruction in Eastern Canada. The results show that d18Ocel of Sphagnum follows the general pattern of the Northern Hemisphere reconstructed paleotemperature record for the last 2000 years at a ratio of c. 0.2%d18Ocel/°C. The d18Ocel record of ombrotrophic phase of Mer Bleue Bog is also in accordance with major features of the Holocene sunspot number reconstruction. Three distinct time intervals have low d18Ocel values: 200-800 cal. BP ("Little Ice Age"); 2800-3400 cal. BP synchronous to a cooling period reported elsewhere in North America; and 4200-4600 cal. BP corresponding to a cooling interval in the North Atlantic region. These cooling periods also correlate well with negative excursions in the Holocene sunspot and cosmogenic 10Be records. A fourth period of low d18Ocel values between AD 1810 and 1820 may be related to the extremely cold summer of 1816 and cooler subsequent years, which occurred in the aftermath of the Tambora volcanic eruption, or possibly cooling associated with the early 19th century Dalton solar minimum. The results also indicate the presence of millennial-scale cycles possibly comparable with the globally recognized Bond cycles that have been correlated to fluctuations in solar irradiance. A modern Maunder Minimum would not stave off global warmingSchultz 2013 EOS 94, 276Roughly every 11 years, the Sun's activity swings, a peak-to-peak oscillation in the presence of sunspots on the solar surface. From around 1645 to 1715, however, researchers think that this largely reliable trend in solar activity stalled. Now known as the Maunder Minimum, the period saw not just a prolonged dearth of sunspot activity but also a likely reduction in the output of energy from the Sun. Researchers estimate that the Maunder Minimum could have caused a reduction in solar irradiance of around 0.01% to 0.25%, a shift that contributed to a drop of globally averaged surface air temperature of a few tenths of a degree. Climate change and decadal to centennial-scale climate periodicities recorded in a late Holocene NE Pacific marine record: Examining the role of solar forcingGalloway et al. 2013 Palaeogeography, Palaeoclimatology, PalaeoecologyWe present a decadal-scale late Holocene climate record based on diatoms, biogenic silica, and grain size from a 12-m sediment core (VEC02A04) obtained from Frederick Sound in the Seymour-Belize Inlet Complex of British Columbia, Canada. Sediments are characterized by graded, massive, and laminated intervals. Laminated intervals are most common between c. 2948-2708 cal. yr BP and c. 1992-1727 cal. yr BP. Increased preservation of laminated sediments and diatom assemblage changes at this time suggest that climate became moderately drier and cooler relative to the preceding and succeeding intervals. Spectral and wavelet analyses are used to test for statistically significant periodicities in time series of proxies of primary production (total diatom abundance, biogenic silica) and hydrology (grain size) preserved in the Frederick Sound record. Periodicities of c. 42-53, 60-70, 82-89, 241-243, and 380 yrs are present. Results are compared to reconstructed sunspot number data of Solanki et al. (2004) using cross wavelet transform to evaluate the role of solar forcing on NE Pacific climate. Significant common power of periodicities between c. 42-60, 70-89, 204-243, and of 380 yrs occur, suggesting that celestial forcing impacted late Holocene climate at Frederick Sound. Replication of the c. 204-243 yr periodicity in sunspot time series is most pronounced between c. 2900 cal. yr BP and c. 2000 cal. yr BP, broadly correlative to the timing of maximum preservation of laminated sedimentary successions and diatom assemblage changes. High solar activity at the Suess/de Vries band may have been manifested as a prolonged westward shift and/or weakening of the Aleutian Low in the mid-late Holocene, which would have diverted fewer North Pacific storms and resulted in the relatively dry conditions reconstructed for the Seymour-Belize Inlet Complex. The Effects of Solar Variability on Earth's Climate: A Workshop Report (September 8-9, 2011)NAS 2012 The National Academies Press, Washington, 71 pp.On September 8-9, 2011, experts in solar physics, climate models, paleoclimatology, and atmospheric science assembled at the National Center for Atmospheric Research (NCAR) in Boulder, Colorado for a workshop to consider the Sun's variability over time and potential Sun-climate connections. While it does not provide findings, recommendations, or consensus on the current state of the science, The Effects of Solar Variability on Earth's Climate: A Workshop Report briefly introduces the primary topics discussed by presenters at the event. As context for these topics, the summary includes background information on the potential Sun-climate connection, the measurement record from space, and potential perturbations of climate due to long-term solar variability. This workshop report also summarizes some of the science questions explored by the participants as potential future research endeavors. Reconciliation of modeled climate responses to spectral solar forcingWen et al. 2013 Journal of Geophysical ResearchThe SIM (Spectral Irradiance Monitor) on SORCE (Solar Radiation and Climate Experiment) provides more spectrally complete daily SSI (spectral solar irradiance) measurements than ever before, allowing us to explore chemical and physical processes in the Earth's ocean and atmosphere system. However, the newly observed SSI instigated controversies in the Sun-climate community on whether the SIM-observed trends are true solar variations and on whether climate responses are in phase or out of phase with solar forcing. In this study, we focus on resolving two apparently contradictory results published on possible temperature responses to SIM-derived solar forcing. When applying extreme scenarios of SIM-based spectral solar forcing in a radiative-convective model (RCM), we find that some apparently contradictory results can be explained by the different methods used to apply the SIM SSI data. It is clear that accurate SSI data are essential for accurate climate simulations and that climate modelers need to take care how they apply these data. Atmospheric annular modes in simulation over the past millennium: No long-term response to external forcingGómez-Navarro and Zorita 2013 Geophysical Research Letters 40, 1-5This study analyzes whether the imprint of external forcings can be detected in the long-term evolution of the main atmospheric circulation patterns in climate simulations over the last millennium. The external forcing is not found to significantly add variability in any frequency band compared to control simulations where the external drivers are kept constant. Additionally, a method designed to detect a common signal in the time evolution of these circulation patterns among all simulations is proposed, and employed to demonstrate that the null hypothesis of an evolution dominated by internal variability cannot be rejected regardless of the time smoothing applied to the series. Given that the fingerprint of external forcings on atmospheric circulation has been successfully detected in simulations of the 20th century climate and in future climate change projections, we argue that either the effect of past natural forcing is too small, state-of-the-art climate models underestimate their climate sensitivity, or the anthropogenic forcing qualitatively differs from the natural forcing in its effect on main circulation patterns. Cosmic-ray-driven reaction and greenhouse effect of halogenated molecules: culprits for atmospheric ozone depletion and global climate changeLu, 2012. International Journal of Modern Physics B 27, 1350073This study is focused on the effects of cosmic rays (solar activity) and halogen-containing molecules (mainly chlorofluorocarbons - CFCs) on atmospheric ozone depletion and global climate change. Brief reviews are first given on the cosmic-ray-driven electron-induced-reaction (CRE) theory for O3 depletion and the warming theory of halogenated molecules for climate change. Then natural and anthropogenic contributions to these phenomena are examined in detail and separated well through in-depth statistical analyses of comprehensive measured datasets of quantities, including cosmic rays (CRs), total solar irradiance, sunspot number, halogenated gases (CFCs, CCl4 and HCFCs), CO2, total O3, lower stratospheric temperatures and global surface temperatures. For O3 depletion, it is shown that an analytical equation derived from the CRE theory reproduces well 11-year cyclic variations of both polar O3 loss and stratospheric cooling, and new statistical analyses of the CRE equation with observed data of total O3 and stratospheric temperature give high linear correlation coefficients >= 0.92. After the removal of the CR effect, a pronounced recovery by 20~25% of the Antarctic O3 hole is found, while no recovery of O3 loss in mid-latitudes has been observed. These results show both the correctness and dominance of the CRE mechanism and the success of the Montreal Protocol. For global climate change, in-depth analyses of the observed data clearly show that the solar effect and human-made halogenated gases played the dominant role in Earth's climate change prior to and after 1970, respectively. Remarkably, a statistical analysis gives a nearly zero correlation coefficient (R = -0.05) between corrected global surface temperature data by removing the solar effect and CO2 concentration during 1850-1970. In striking contrast, a nearly perfect linear correlation with coefficients as high as 0.96-0.97 is found between corrected or uncorrected global surface temperature and total amount of stratospheric halogenated gases during 1970-2012. Furthermore, a new theoretical calculation on the greenhouse effect of halogenated gases shows that they (mainly CFCs) could alone result in the global surface temperature rise of ~0.6°C in 1970-2002. These results provide solid evidence that recent global warming was indeed caused by the greenhouse effect of anthropogenic halogenated gases. Thus, a slow reversal of global temperature to the 1950 value is predicted for coming 5~7 decades. It is also expected that the global sea level will continue to rise in coming 1~2 decades until the effect of the global temperature recovery dominates over that of the polar O3 hole recovery; after that, both will drop concurrently. All the observed, analytical and theoretical results presented lead to a convincing conclusion that both the CRE mechanism and the CFC-warming mechanism not only provide new fundamental understandings of the O3 hole and global climate change but have superior predictive capabilities, compared with the conventional models. Multidecadal to multicentury scale collapses of Northern Hemisphere monsoons over the past millenniumAsmerom et al. 2013 PNASLate Holocene climate in western North America was punctuated by periods of extended aridity called megadroughts. These droughts have been linked to cool eastern tropical Pacific sea surface temperatures (SSTs). Here, we show both short-term and long-term climate variability over the last 1,500 y from annual band thickness and stable isotope speleothem data. Several megadroughts are evident, including a multicentury one, AD 1350-1650, herein referred to as Super Drought, which corresponds to the coldest period of the Little Ice Age. Synchronicity between southwestern North American, Chinese, and West African monsoon precipitation suggests the megadroughts were hemispheric in scale. Northern Hemisphere monsoon strength over the last millennium is positively correlated with Northern Hemisphere temperature and North Atlantic SST. The megadroughts are associated with cooler than average SST and Northern Hemisphere temperatures. Furthermore, the megadroughts, including the Super Drought, coincide with solar insolation minima, suggesting that solar forcing of sea surface and atmospheric temperatures may generate variations in the strength of Northern Hemisphere monsoons. Our findings seem to suggest stronger (wetter) Northern Hemisphere monsoons with increased warming. Solar influence on climate variability and human development during the Neolithic: evidence from a high-resolution multi-proxy record from Templevanny Lough, County Sligo, IrelandStolze et al. 2013 Quaternary Science Reviews 67, 138-159The relationship between climatic variations, vegetation dynamics and early human activity between c. 4150-2860 BC was reconstructed from a high-resolution pollen and geochemical record obtained from a small lake located in County Sligo, Ireland. The proxy record suggests the existence of a woodland with a largely closed canopy at the start of the fourth millennium BC. Only minor human disturbance is recorded. Following an episode of increased rainfall at c. 3990 BC, a decrease in the elm population occurred between c. 3970 and 3820 BC. This coincided with a period of warming and drying climatic conditions and an initial increase in anthropogenic activities. A second episode of high precipitation between c. 3830-3800 BC was followed by a steep increase in human impact on the landscape, which became most pronounced between c. 3740 and 3630 BC. At this time, the lake level of Templevanny Lough was at its lowest during the Neolithic. The onset of wetter and cooler conditions after c. 3670 BC, representing the transition from the Early to the Middle Neolithic, coincided with a period of woodland recovery. The Middle Neolithic was characterised by pronounced climatic oscillations including periods of substantial rainfall between c. 3600 and 3500 BC and between c. 3500 and 3460 BC. A nearly century-long climatic amelioration between c. 3460-3370 BC facilitated a revival of human activity on a small scale around the lake. Abandonment of the area and full woodland recovery occurred after a period of particularly wet and cool conditions ranging from c. 3360-3290 BC. The pollen and geochemistry data suggest that the Late Neolithic was marked by a period of ameliorated conditions between c. 3110-3050 BC that was followed by two episodes of high rainfall at c. 3060-3030 BC and c. 2940-2900 BC. The timing of the climatic shifts inferred from the Templevanny Lough record is in agreement with those of moisture/precipitation and temperature reconstructions from northern and western Europe and the Alps, suggesting that the studied period was characterised by a high-frequency climate variability. The results of the present study imply that human development during the Irish Neolithic was influenced by climatic variations. These climatic shifts correspond to variations in solar activity, suggesting a solar forcing on climate. Claim of solar influence is on thin ice: are 11-year cycle solar minima associated with severe winters in Europe?van Oldenborgh et al. 2013 Environmental Research Letters 8, 024014A recent paper in Geophysical Research Letters, 'Solar influence on winter severity in central Europe', by Sirocko et al (2012 Geophys. Res. Lett. 39 L16704) claims that 'weak solar activity is empirically related to extremely cold winter conditions in Europe' based on analyses of documentary evidence of freezing of the River Rhine in Germany and of the Reanalysis of the Twentieth Century (20C). However, our attempt to reproduce these findings failed. The documentary data appear to be selected subjectively and agree neither with instrumental observations nor with two other reconstructions based on documentary data. None of these datasets show significant connection between solar activity and winter severity in Europe beyond a common trend. The analysis of Sirocko et al of the 20C circulation and temperature is inconsistent with their time series analysis. A physically-motivated consistent methodology again fails to support the reported conclusions. We conclude that multiple lines of evidence contradict the findings of Sirocko et al. The importance of time-varying forcing for QBO modulation of the atmospheric 11-year solar cycle signalMatthes et al. 2013 Journal Of Geophysical Research AtmospheresWe present results from three multi-decadal sensitivity experiments with time-varying solar cycle and Quasi-Biennial Oscillation (QBO) forcings using NCAR's Whole Atmosphere Community Climate Model (WACCM3.1). The model experiments are unique compared to earlier studies as they use time-varying forcings either for the solar cycle only and the QBO, both individually and combined. The results show that the annual mean solar response in the tropical upper stratosphere is independent of the presence of the QBO. The response in the middle to lower stratosphere differs depending on the presence of the QBO and the solar cycle but is statistically indistinguishable in the three experiments. The seasonal evolution of the solar and the combined solar-QBO signals reveals a reasonable agreement with observations only for the experiment in which both the solar cycle and the QBO forcing are present, suggesting that both forcings are important to generate the observed response. More stratospheric warmings occur during solar maximum and QBO west conditions. This appears to be the result of a QBO modulation of the background zonalmean wind climatology, which modifies the solar signal. Depending on the background wind the small initial early winter solar signal in the subtropical upper stratosphere/lower mesosphere is enhanced during QBO east and diminished during QBO west conditions. This consequently influences the transfer of the solar-QBO signal during winter and results in the observed differences during late winter. Could a future "Grand Solar Minimum" like the Maunder Minimum stop global warming?Meehl et al. 2013 Geophysical Research LettersA future Maunder Minimum type grand solar minimum, with total solar irradiance reduced by 0.25% over a 50 year period from 2020 to 2070, is imposed in a future climate change scenario experiment (RCP4.5) using, for the first time, a global coupled climate model that includes ozone chemistry and resolved stratospheric dynamics (Whole Atmosphere Community Climate Model). This model has been shown to simulate two amplifying mechanisms that produce regional signals of decadal climate variability comparable to observations, and thus is considered a credible tool to simulate the Sun's effects on Earth's climate. After the initial decrease of solar radiation in 2020, globally averaged surface air temperature cools relative to the reference simulation by up to several tenths of a degree Centigrade. By the end of the grand solar minimum in 2070, the warming nearly catches up to the reference simulation. Thus, a future grand solar minimum could slow down but not stop global warming. Solar influenced late Holocene temperature changes on the northern Tibetan PlateauYuXin et al. 2013 Chinese Science Bulletin 58, 1053-1059Considerable efforts have been made to extend temperature records beyond the instrumental period through proxy reconstructions, in order to further understand the mechanisms of past climate variability. Yet, the global coverage of existing temperature records is still limited, especially for some key regions like the Tibetan Plateau and for earlier times including the Medieval Warm Period (MWP). Here we present decadally-resolved, alkenone-based, temperature records from two lakes on the northern Tibetan Plateau. Characterized by marked temperature variability, our records provide evidence that temperatures during the MWP were slightly higher than the modern period in this region. Further, our temperature reconstructions, within age uncertainty, can be well correlated with solar irradiance changes, suggesting a possible link between solar forcing and natural climate variability, at least on the northern Tibetan Plateau. The AD775 cosmic event revisited: the Sun is to blameUsoskin et al. 2013 Astronomy & Astrophysics 552, L3Aims. Miyake et al. (2012, Nature, 486, 240, henceforth M12) recently reported, based on 14C data, an extreme cosmic event in about AD775. Using a simple model, M12 claimed that the event was too strong to be caused by a solar flare within the standard theory. This implied a new paradigm of either an impossibly strong solar flare or a very strong cosmic ray event of unknown origin that occurred around AD775. However, as we show, the strength of the event was significantly overestimated by M12. Several subsequent works have attempted to find a possible exotic source for such an event, including a giant cometary impact upon the Sun or a gamma-ray burst, but they are all based on incorrect estimates by M12. We revisit this event with analysis of new datasets and consistent theoretical modelling. Methods. We verified the experimental result for the AD775 cosmic ray event using independent datasets including 10Be series and newly measured 14C annual data. We surveyed available historical chronicles for astronomical observations for the period around the AD770s to identify potential sightings of aurorae borealis and supernovae. We interpreted the 14C measurements using an appropriate carbon cycle model. Results. We show that: (1) The reality of the AD775 event is confirmed by new measurements of 14C in German oak; (2) by using an inappropriate carbon cycle model, M12 strongly overestimated the event''s strength; (3) the revised magnitude of the event (the global 14C production Q = (1.1 - 1.5) x 108 atoms/cm2) is consistent with different independent datasets (14C, 10Be, 36Cl) and can be associated with a strong, but not inexplicably strong, solar energetic particle event (or a sequence of events), and provides the first definite evidence for an event of this magnitude (the fluence >30 MeV was about 4.5 x 1010 cm-2) in multiple datasets; (4) this interpretation is in agreement with increased auroral activity identified in historical chronicles. Conclusions. The results point to the likely solar origin of the event, which is now identified as the greatest solar event on a multi-millennial time scale, placing a strong observational constraint on the theory of explosive energy releases on the Sun and cool stars. Terrestrial effects of possible astrophysical sources of an AD 774-775 increase in 14C productionThomas et al. 2013 Geophysical Research LettersWe examine possible sources of a substantial increase in tree ring 14C measurements for the years AD 774-775. Contrary to claims regarding a coronal mass ejection (CME), the required CME energy is not several orders of magnitude greater than known solar events. We consider solar proton events (SPEs) with three different fluences and two different spectra. The data may be explained by an event with fluence about one order of magnitude beyond the October 1989 SPE. Two hard spectrum cases considered here result in moderate ozone depletion, so no mass extinction is implied, though we do predict increases in erythema and damage to plants from enhanced solar UV. We are able to rule out an event with a very soft spectrum that causes severe ozone depletion and subsequent biological impacts. Nitrate enhancements are consistent with their apparent absence in ice core data. The modern technological implications of such an event may be extreme, and considering recent confirmation of superflares on solar-type stars, this issue merits attention. Modeled rapid adjustments in diurnal temperature range response to CO2 and solar forcingsJackson and Foster 2013 Journal Of Geophysical Research: AtmospheresWe used the National Center for Atmospheric Research single column climate model to determine if rapid adjustments to surface heat fluxes contribute to a change in skin surface or surface air diurnal temperature range (DTR) under 2 × CO2 and -2% solar forcings. An ensemble of model runs was employed with locations selected to represent a range of different climatic conditions and with forcing implemented hourly throughout the diurnal cycle. The change in skin surface DTR and surface energy fluxes during the 3 days after forcing were used to quantify the rapid adjustment response and temperature related feedback. Averaged over all locations, skin surface DTR reduced by 0.01C after CO2 forcing and included a rapid adjustment to skin surface DTR of -0.12C. Skin surface DTR reduced by 0.17C after solar forcing and included a rapid adjustment of -0.01C. The rapid adjustments in skin surface DTR were associated with rapid adjustments in surface sensible and latent heat fluxes necessary to balance the energy budget immediately after forcing. We find that the sensitivity of skin surface DTR to mean temperature related feedback is the same for CO2 and solar forcings when skin surface DTR rapid adjustments are allowed for. Rapid adjustments played a key role in the geographic variation of the skin surface DTR response to forcing. Our results suggest that diurnal variations in trends of downwelling longwave radiation and rapid reductions in DTR associated with CO2 forcing potentially contributed to the observed global trend in surface air DTR. On the origin of multidecadal to centennial Greenland temperature anomalies over the past 800 yrKobashi et al. 2013 Climate of the Past 9, 583-596The surface temperature of the Greenland ice sheet is among the most important climate variables for assessing how climate change may impact human societies due to its association with sea level rise. However, the causes of multidecadal-to-centennial temperature changes in Greenland temperatures are not well understood, largely owing to short observational records. To examine these, we calculated the Greenland temperature anomalies (GTA[G-NH]) over the past 800 yr by subtracting the standardized northern hemispheric (NH) temperature from the standardized Greenland temperature. This decomposes the Greenland temperature variation into background climate (NH); polar amplification; and regional variability (GTA[G-NH]). The central Greenland polar amplification factor as expressed by the variance ratio Greenland/NH is 2.6 over the past 161 yr, and 3.3-4.2 over the past 800 yr. The GTA[G-NH] explains 31-35 % of the variation of Greenland temperature in the multidecadal-to-centennial time scale over the past 800 yr. We found that the GTA[G-NH] has been influenced by solar-induced changes in atmospheric circulation patterns such as those produced by the North Atlantic Oscillation/Arctic Oscillation (NAO/AO). Climate modeling and proxy temperature records indicate that the anomaly is also likely linked to solar-paced changes in the Atlantic meridional overturning circulation (AMOC) and associated changes in northward oceanic heat transport. Solar influence on climate variability and human development during the Neolithic: evidence from a high-resolution multi-proxy record from Templevanny Lough, County Sligo, IrelandStolze et al. 2013 Quaternary Science Reviews 67, 138-159The relationship between climatic variations, vegetation dynamics and early human activity between c. 4150-2860 BC was reconstructed from a high-resolution pollen and geochemical record obtained from a small lake located in County Sligo, Ireland. The proxy record suggests the existence of a woodland with a largely closed canopy at the start of the fourth millennium BC. Only minor human disturbance is recorded. Following an episode of increased rainfall at c. 3990 BC, a decrease in the elm population occurred between c. 3970 and 3820 BC. This coincided with a period of warming and drying climatic conditions and an initial increase in anthropogenic activities. A second episode of high precipitation between c. 3830-3800 BC was followed by a steep increase in human impact on the landscape, which became most pronounced between c. 3740 and 3630 BC. At this time, the lake level of Templevanny Lough was at its lowest during the Neolithic. The onset of wetter and cooler conditions after c. 3670 BC, representing the transition from the Early to the Middle Neolithic, coincided with a period of woodland recovery. The Middle Neolithic was characterised by pronounced climatic oscillations including periods of substantial rainfall between c. 3600 and 3500 BC and between c. 3500 and 3460 BC. A nearly century-long climatic amelioration between c. 3460-3370 BC facilitated a revival of human activity on a small scale around the lake. Abandonment of the area and full woodland recovery occurred after a period of particularly wet and cool conditions ranging from c. 3360-3290 BC. The pollen and geochemistry data suggest that the Late Neolithic was marked by a period of ameliorated conditions between c. 3110-3050 BC that was followed by two episodes of high rainfall at c. 3060-3030 BC and c. 2940-2900 BC. The timing of the climatic shifts inferred from the Templevanny Lough record is in agreement with those of moisture/precipitation and temperature reconstructions from northern and western Europe and the Alps, suggesting that the studied period was characterised by a high-frequency climate variability. The results of the present study imply that human development during the Irish Neolithic was influenced by climatic variations. These climatic shifts correspond to variations in solar activity, suggesting a solar forcing on climate. Geomagnetic field variations in Western Europe from 1500BC to 200 AD. Part II: new intensity secular variation curveHervé et al. in press Physics of the Earth and Planetary InteriorsIn order to extend the secular variation curve (SVC) of archaeointensity in Western Europe to the first millennium BC, we studied 24 kilns and hearths in place, 2 displaced hearths and 6 sets of pottery sherds from French archaeological sites. Archaeological artefacts, radiocarbon and dendrochronology dated the acquisition of the thermoremanent magnetization (TRM) carried by the studied objects. Rock magnetism experiments suggest that the main carrier of the magnetization is a Ti-poor titanomagnetite. Archaeointensity was determined by the Thellier-Thellier classical protocol with pTRM-checks. A strict criteria set was applied to select only the most reliable results with linear NRM-TRM diagrams (55% of total specimens). This study demonstrates that pottery sherds with two TRMs give reliable archaeointensities in the low-temperature interval, if the NRM-TRM diagram is adequately adjusted. Eighteen new mean archaeointensities (14 corrected from the anisotropy of TRM and 16 from cooling rate) were computed. The comparison with previously published Western Europe paleointensities show a strong dispersion between data primarily due to their variable quality. Western Europe data were weighted following the archaeointensity protocol, the number of specimens per site and the type of studied materials, in order to better highlight the secular variation of archaeointensity during the first millennium BC. The SVC, built with sliding windows of 160 years shifted every 50 years, presents (at Paris) a maximum of 90uT around 800BC and a minimum of 60uT around 250BC. These archaeointensity maximum and minimum correspond to cusps of the geomagnetic field direction in Western Europe. This new curve is consistent with Mesopotamian and Eastern Europe data. The archaeointensity secular variation in Western Europe predicted by global geomagnetic models CALS3k.4, ARCH3k.1 and ARCH3k_cst.1 is smoother than our SVC. We used our directional dataset (Hervé et al., 2012a) to build a new Western Europe VGPs and VDMs mean curves. Comparison with the predictions given by the global models points out a possible persistent non-dipole fields effect over Europe between 1000BC and 600-500BC. Finally, we note that the strong variations of intensity of the geomagnetic field (with a mean decrease rate per century close to 6uT) will be useful for archaeomagnetic dating purposes. A synthesis of the Antarctic surface mass balance during the last 800 yrFrezotti et al. 2013 The Cryosphere 7, 303-319Global climate models suggest that Antarctic snowfall should increase in a warming climate and mitigate rises in the sea level. Several processes affect surface mass balance (SMB), introducing large uncertainties in past, present and future ice sheet mass balance. To provide an extended perspective on the past SMB of Antarctica, we used 67 firn/ice core records to reconstruct the temporal variability in the SMB over the past 800 yr and, in greater detail, over the last 200 yr. Our SMB reconstructions indicate that the SMB changes over most of Antarctica are statistically negligible and that the current SMB is not exceptionally high compared to the last 800 yr. High-accumulation periods have occurred in the past, specifically during the 1370s and 1610s. However, a clear increase in accumulation of more than 10 % has occurred in high SMB coastal regions and over the highest part of the East Antarctic ice divide since the 1960s. To explain the differences in behaviour between the coastal/ice divide sites and the rest of Antarctica, we suggest that a higher frequency of blocking anticyclones increases the precipitation at coastal sites, leading to the advection of moist air in the highest areas, whereas blowing snow and/or erosion have significant negative impacts on the SMB at windy sites. Eight hundred years of stacked records of the SMB mimic the total solar irradiance during the 13th and 18th centuries. The link between those two variables is probably indirect and linked to a teleconnection in atmospheric circulation that forces complex feedback between the tropical Pacific and Antarctica via the generation and propagation of a large-scale atmospheric wave train. Variation of the Schwabe Cycle length during the Grand Solar Minimum in the 4th Century BC deduced from radiocarbon content in tree ringsNagaya et al. 2012 Solar Physics 280, 223-236Solar activity alternates between active and quiet phases with an average period of 11 years, and this is known as the Schwabe cycle. Additionally, solar activity occasionally falls into a prolonged quiet phase (grand solar minimum), as represented by the Maunder Minimum in the 17th century, when sunspots were almost absent for 70 years and the length of the Schwabe cycle increased to 14 years. To examine the consistency of the cycle length characteristics during the grand solar minima, the carbon-14 contents in single-year tree rings were measured using an accelerator mass spectrometer as an index of the solar variability during the grand solar minimum of the 4th century BC. The signal of the Schwabe cycle was detected with a statistical confidence level of higher than 95% by wavelet analysis. This is the oldest evidence for the Schwabe cycle at the present time, and the cycle length is considered to have increased to approximately 16 years during the grand solar minimum of the 4th century BC. This result confirms the association between the increase of the Schwabe cycle length and the weakening of solar activity, and indicates the possible prolonged absence of sunspots in the 4th century BC as during the Maunder Minimum. Theoretical implications from solar dynamo theory are discussed in order to identify the trigger of prolonged sunspot absence. A possible association between the long-term solar variation around the 4th century BC and terrestrial cooling in this period is also discussed. Phytolith records of the climate change since the past 15000 years in the middle reach of the Yangtze River in ChinaGu et al. 2012 Frontiers of Earth Science 6, 10-17Based on 14C dating and core sediments survey, phytolith records are employed to reconstruct paleovegetation and paleoclimate in the Jianghan Plain in the middle reach of the Yangtze River. Phytoliths identified are assigned into 21 well-described morphotypes and divided into four groups (Poaceae, fern, coniferous and broad-leaved). The phytolith assemblages together with warmth index (Iw) are divided into 18 ecological zones, which reflect a complete vegetation history related to climate change in the middle reach of the Yangtze River during the past 15000 years. On the basis of the correlation of phytolith records with the paleoclimatic indicators from stalagmite, peatland, North Atlantic deep-sea sediments, Loess Plateau of Central China, and Arabic Sea sediments, eight climatic phases are identified included Last Glacial Maximum (LGM) (20 - 14.8 cal kaBP), Last Deglaciation (LDG) (14.8 - 11.9 cal kaBP), low-temperature phase in the Early Holocene (11.9 - 8 cal kaBP), Holocene Optimum (8 - 4.9 cal kaBP), Holocene Katathermal (4.9 - 1.1 cal kaBP), Medieval Warmth Period (MWP) (1.1 - 0.7 cal kaBP), Little Ice Age (LIA) (0.7 - 0.15 cal kaBP), and Modern Warming (0.15 cal kaBP - present). Climatic events such as Bolling-Allerod warm intervals, Older Dryas, Inter-Allerod Cold Period, and Younger Dryas, and eight Holocene Bond events (B1-8) have been identified since the LDG. Our results demonstrate that the evolution of the climate in the research area has a strong link with the Indian Summer Monsoon (SW Monsoon), Asian Summer Monsoon (SE Monsoon), and Holocene events in North Atlantic simultaneously, which might indicate that solar variability affects the Earth surface climate system at the centennial and millennial scales. A possible solar pacemaker for Holocene fluctuations of a salt-marsh in southern ItalyDi Rita 2013 Quaternary International 288, 239-248This study is aimed at verifying the possible influence of solar activity on the coastal vegetation development in the Tavoliere Plain (south Adriatic region, Italy) between 6350 and 4000 cal BP, when regular fluctuations of halophilic vegetation are recorded by pollen. A wavelet analysis, applied to the percentage values of glasswort vegetation is consistent with periodicities of solar activity and other palaeoenvironmental and palaeoclimate proxies in the literature. A comparison of salt-marsh pollen indicators (Salicornia type and Ruppia maritima) with the 10Be dataset from the Greenland ice core GISP2, on the basis of their independent chronologies, reveals a strong visual correlation, indicating that the minima of salt-marsh percentages match minima in the 10Be curve, corresponding to solar activity maxima, associated with warm and arid phases at the middle latitudes. The Tavoliere salt-marsh appears to have contracted during the arid/warm phases associated to maxima of solar activity and to have expanded during the wet/cold phases of solar minima. This coastal area, characterized by a very flat topography and arid climate, appears to have been very sensitive to even minor hydrological and climate changes. Changes of solar activity, determining extensive environmental transformations, were also possibly responsible for the abandonment of the human coastal settlements of one of the most important Neolithic archaeological districts of Italy. Influence of the Pacific Decadal Oscillation, El Nino-Southern Oscillation and solar forcing on climate and primary productivity changes in the northeast PacificPatterson et al. in press Quaternary InternationalEvidence of 11-year Schwabe solar sunspot cycles, El Niño-Southern Oscillation (ENSO) and the Pacific Decadal Oscillation (PDO) were detected in an annual record of diatomaceous laminated sediments from anoxic Effingham Inlet, Vancouver Island, British Columbia. Radiometric dating and counting of annual varves dates the sediments from AD 1947-1993. Intact sediment slabs were X-rayed for sediment structure (lamina thickness and composition based on gray scale), and subsamples were examined for diatom abundances and for grain size. Wavelet analysis reveals the presence of c. 2-3, c. 4.5, c. 7 and c. 9-12-year cycles in the diatom record and an c. 11-13 year record in the sedimentary varve thickness record. These cycle lengths suggest that both ENSO and the sunspot cycle had an influence on primary productivity and sedimentation patterns. Sediment grain size could not be correlated to the sunspot cycle although a peak in the grain size data centered around the mid-1970s may be related to the 1976-1977 Pacific climate shift, which occurred when the PDO index shifted from negative (cool conditions) to positive (warm conditions). Additional evidence of the PDO regime shift is found in wavelet and cross wavelet results for Skeletonema costatum, a weakly silicified variant of S. costatum, annual precipitation and April to June precipitation. Higher spring (April/May) values of the North Pacific High pressure index during sunspot minima suggest that during this time, increased cloud cover and concomitant suppression of the Aleutian Low (AL) pressure system led to strengthened coastal upwelling and enhanced diatom production earlier in the year. These results suggest that the 11-year solar cycle, amplified by cloud cover and upwelling changes, as well as ENSO, exert significant influence on marine primary productivity in the northeast Pacific. The expression of these cyclic phenomena in the sedimentary record were in turn modulated by the phase of PDO, as indicated by the change in period of ENSO and suppression of the solar signal in the record after the 1976-1977 regime shift. A study on possible solar and geomagnetic effects on the precipitation over Northwestern ArgentinaHeredia and Elias 2013 Advances in Space ResearchThe precipitation over Tucuman (26.8 S; 65.2 W), which is representative of the Northwestern region of Argentina, is analyzed in search of an association with solar and geomagnetic activity, with the purpose of contributing to the controversial issue on the connection between climate variation and anthropogenic vs. natural forcing. Monthly time series of precipitation, sunspot number (Rz), and aa index were used for the period 1884-2010. A wavelet analysis was performed first which, due to the time series length, shows significant results only for periodicities lower than 32 years. Due to the transient character and non-constant phase of the results, any sustained wavelet coherence between precipitation and either sunspots or aa could be noticed. Moving averages and correlations were also assessed. The 11 and 22-year running mean of precipitation is positively correlated to Rz and aa when the whole period of analysis is considered. However, a shift in the long-term behavior of precipitation is noticed around 1940, which implies different correlation values with Rz and aa when the period before or after this year are considered. The solar cycle length is also considered for this statistical study and partly confirms the results obtained with Rz and aa. We propose plausible physical explanations based on geomagnetic activity and total solar irradiance effects over atmospheric circulation that could support the statistical result. A deeper analysis and broader geographical coverage is needed in order to detect a connection between precipitation and solar variability discernible from greenhouse gases effects. We emphasize the idea of the importance of recognizing and quantifying the different forcing acting on precipitation (or any other climate parameter), which sometimes can be barely evident from a solely statistical analysis. The planetary hypothesis revivedCharbonneau 2013 Nature 493, 613-614The Sun's magnetic activity varies cyclically over a period of about 11 years. An analysis of a new, temporally extended proxy record of this activity hints at a possible planetary influence on the amplitude of the cycle. Using data to attribute episodes of warming and cooling in instrumental recordsTung and Zhou 2013 PNASThe observed global-warming rate has been nonuniform, and the cause of each episode of slowing in the expected warming rate is the subject of intense debate. To explain this, nonrecurrent events have commonly been invoked for each episode separately. After reviewing evidence in both the latest global data (HadCRUT4) and the longest instrumental record, Central England Temperature, a revised picture is emerging that gives a consistent attribution for each multidecadal episode of warming and cooling in recent history, and suggests that the anthropogenic global warming trends might have been overestimated by a factor of two in the second half of the 20th century. A recurrent multidecadal oscillation is found to extend to the preindustrial era in the 353-y Central England Temperature and is likely an internal variability related to the Atlantic Multidecadal Oscillation (AMO), possibly caused by the thermohaline circulation variability. The perspective of a long record helps in quantifying the contribution from internal variability, especially one with a period so long that it is often confused with secular trends in shorter records. Solar contribution is found to be minimal for the second half of the 20th century and less than 10% for the first half. The underlying net anthropogenic warming rate in the industrial era is found to have been steady since 1910 at 0.07-0.08 C/decade, with superimposed AMO-related ups and downs that included the early 20th century warming, the cooling of the 1960s and 1970s, the accelerated warming of the 1980s and 1990s, and the recent slowing of the warming rates. Quantitatively, the recurrent multidecadal internal variability, often underestimated in attribution studies, accounts for 40% of the observed recent 50-y warming trend. High-resolution analysis of upper Miocene lake deposits: Evidence for the influence of Gleissberg-band solar forcingKern et al. 2013 Palaeogeography, Palaeoclimatology, Palaeoecology 370, 167-183A high-resolution multi-proxy analysis was conducted on a 1.5-m-long core of Tortonian age (~ 10.5 Ma; Late Miocene) from Austria (Europe). The lake sediments were studied with a 1-cm resolution to detect all small-scale variations based on palynomorphs (pollen and dinoflagellate cysts), ostracod abundance, geochemistry (carbon and sulfur) and geophysics (magnetic susceptibility and natural gamma radiation). Based on an already established age model for a longer interval of the same core, this sequence can be limited to approx. two millennia of Late Miocene time with a resolution of ~ 13.7 years per sample. The previous study documented the presence of solar forcing, which was verified within various proxies on this 1.5-m core by a combination of REDFIT spectra and Gaussian filters. Significant repetitive signals ranged in two discrete intervals corresponding roughly to 55-82 and 110-123 years, fitting well within the lower and upper Gleissberg cycle ranges. Based on these results, the environmental changes along the 2000-year Late Miocene sequence are discussed. No major ecological turnovers are expected in this very short interval. Nonetheless, even within this brief time span, dinoflagellates document rapid changes between oligotrophic and eutrophic conditions, which are frequently coupled with lake stratification and dysoxic bottom waters. These phases prevented ostracods and molluscs from settling and promoted the activity of sulfur bacteria. The pollen record indicates rather stable wetland vegetation with a forested hinterland. Shifts in the pollen spectra can be mainly attributed to variations in transport mechanisms. These are represented by a few phases of fluvial input but mainly by changes in wind intensity and probably also wind direction. Such influence is most likely caused by solar cycles, leading to a change in source area for the input into the lake. Furthermore, these solar-induced variations seem to be modulated by longer solar cycles. The filtered data display comparable patterns and modulations, which seem to be forced by the 1000-year and 1500-year cycles. The 1000-year cycle modulated especially the lake surface proxies, whereas the 1500-year cycle is mainly reflected in hinterland proxies, indicating strong influence on transport mechanisms. Paleoclimate of the Southern Adriatic Sea region during the 'Medieval Climate Anomaly' reflected by organic walled dinoflagellate cystsChen et al. 2013 The HoloceneTo obtain insight into the character and forcing of southern Italian climate change during the 'Medieval Climate Anomaly' (c. AD 900-1200), marine sediments deposited between AD 990 and 1200 from the Gulf of Taranto have been analyzed for their dinoflagellate cyst content with a 3.5 yr resolution. The reconstructed sea surface temperature (SST) appears to be lower than today. We observe a clear 11.4 yr cyclicity in the reconstructed SST series. Furthermore, there is a good matching between SST and global 14C anomalies. This suggests that solar activity might have had an important influence on the local climate during Medieval time. Short-term fluctuations in accumulation rates of aerobic degradation resistant species that react sensitively on the trophic state of the upper waters and/or are characteristic for river plume waters indicate that the trophic state of the upper waters is closely linked to river discharge, which in turn is strongly related to precipitation in Italy. We reconstruct low river discharge/precipitations in the Adriatic area synchronous to widespread drought events in other nearby subtropical regions. We attribute this to NAO and ENSO related large-scale ocean-atmosphere circulation shifts during the Medieval period. Furthermore, we suggest that eruptions of southern Italian volcanoes might have influenced the local upper water nutrient conditions as well. Influence of solar activity on breaching, overflowing and course-shifting events of the Lower Yellow River in the late HoloceneWang & Su 2013 The HoloceneThe Lower Yellow River (LYR) has been characterized as a frequently breaching, overflowing and shifting river in historical periods. Understanding the factors that influence the LYR variations is critical for river management and disaster prevention. This study constructed a spatio-temporal data base of the LYR's breaching and overflowing events (BOEs) and course-shifting events (CSEs) occurring in the late Holocene. The data base and corresponding solar activity data were analyzed to determine the overall influence, temporal influence and spatial influence of solar activity on the LYR. Results showed that 75.5% of the LYR CSEs and 61.7% of the LYR BOEs occurred in sunspot number decline phases of 11 yr solar cycles, suggesting that the LYR changed more frequently during the sunspot number decline phases. The underlying mechanism of this phenomenon was further interpreted as the high correlation between sunspot decline phases and heavy rainfall in the middle reaches of Yellow River (MYR). Five of the six heavy rainfall years over the last 60 years and 14 of the 16 well-known heavy rainfall records from 132 BC to AD 1933 in the MYR occurred in sunspot decline phases. Heavy rainfall in the MYR promoted the increase of the LYR runoff and the sediment rate and then raised the possibility of the occurrence of BOEs and CSEs. The study also found that the frequency of BOEs was positively related to the fluctuation amplitude of the sunspot maximum intensity in long time series. The flow directions of the LYR courses were found to affect the influence of solar activity on BOEs. The highest correlation between sunspot decline phases and BOEs was presented during the lifetime of eastward flows while the lowest during the lifetime of northward flows. In addition, human activities may undermine the impact of solar activities on the LYR changes. Are the sunspots really vanishing? Anomalies in solar cycle 23 and implications for long-term models and proxiesClete and Lefevre 2012 J. Space Weather Space Clim. 2 A06Context: The elapsed solar cycle (23) ended with an exceptionally long period of low activity and with unprecedented low levels for various series of solar irradiance and particle flux measurements. This unpredicted evolution of solar activity raised multiple questions about a future decline of the solar cycles and launched a quest for precursor signs of this possible deep solar transition over the last decade. Aim: We present here a review and overall interpretation of most current diagnostics of solar cycle 23, including the recent disagreements that appeared among solar reference indices and standard solar-based geo-indices, the indication of a changed pattern of internal torsional waves (helioseismology) or the announced fading and magnetic weakening of sunspots. Methods: Based on a statistical analysis of detailed sunspot properties over the last 24 years, we complete the picture with new evidence of a strong global deficit of the smallest sunspots starting around 2000, in order to answer the question: are all sunspots about to disappear? Results: This global scale-dependent change in sunspot properties is confirmed to be real and not due to uncontrolled biases in some of the indices. It can also explain the recent discrepancies between solar indices by their different sensitivities to small and weak magnetic elements (small spots). The International Sunspot Index Ri, based on unweighted sunspot counts, proved to be particularly sensitive to this particular small-scale solar evolution. Conclusions: Our results and interpretation show the necessity to look backwards in time, more than 80 years ago. Indeed, the Sun seems to be actually returning to a past and hardly explored activity regime ending before the 1955-1995 Grand Maximum, which probably biased our current space-age view of solar activity. Influence of orbital forcing and solar activity on water isotopes in precipitation during the mid- and late HoloceneDietrich et al. 2013 Climate of the Past 9, 13-26In this study we investigate the impact of mid- and late Holocene orbital forcing and solar activity on variations of the oxygen isotopic composition in precipitation. The investigation is motivated by a recently published speleothem d18O record from the well-monitored Bunker Cave in Germany. The record reveals some high variability on multi-centennial to millennial scales that does not linearly correspond to orbital forcing. Our model study is based on a set of novel climate simulations performed with the atmosphere general circulation model ECHAM5-wiso enhanced by explicit water isotope diagnostics. From the performed model experiments, we derive the following major results: (1) the response of both orbital and solar forcing lead to changes in surface temperatures and d18O in precipitation with similar magnitudes during the mid- and late Holocene. (2) Past d18O anomalies correspond to changing temperatures in the orbital driven simulations. This does not hold true if an additional solar forcing is added. (3) Two orbital driven mid-Holocene experiments, simulating the mean climate state approximately 5000 and 6000 yr ago, yield very similar results. However, if an identical additional solar activity-induced forcing is added, the simulated changes of surface temperatures as well as d18O between both periods differ. We conclude from our simulation results that non-linear effects and feedbacks of the orbital and solar activity forcing substantially alter the d18O in precipitation pattern and its relation to temperature change. Summed radiocarbon probability density functions cannot prove solar forcing of Central European lake-level changesBleicher, 2013 The HoloceneIt has been argued that Central European lake levels were driven by solar activity. This interpretation rests on the comparison of a score record of radiocarbon dates with the 14C residual curve. This score record is a variant of a cumulative probability density function (CPF). In this paper it is argued that this method is not valid because the shape of the CPF is determined by the calibration curve. This hypothesis is tested by a set of null models. An alternative interpretation is given according to which only few episodes of Holocene lake-level changes were climatically driven, while most of the time non-climatic factors were dominating. On a more general level some methodological issues of CPFs are discussed and exemplified by the comparison of dendrochronological results from archaeological settlements and a CPF created using radiocarbon dates from the same settlements. A Mechanism for Lagged North Atlantic Climate Response to Solar VariabilityScaife et al. 2013 Geophysical Research Letters, in pressVariability in solar irradiance has been connected to changes in surface climate in the North Atlantic through both observational and climate modelling studies which suggest a response in the atmospheric circulation that resembles the North Atlantic Oscillation or its hemispheric equivalent the Arctic Oscillation. It has also been noted that this response appears to follow the changes in solar irradiance by a few years, depending on the exact indicator of solar variability. Here we propose and test a mechanism for this lag based on the known impact of atmospheric circulation on the Atlantic Ocean, the extended memory of ocean heat content anomalies and their subsequent feedback onto the atmosphere. We use results from climate model experiments to develop a simple model for the relationship between solar variability and North Atlantic climate. Circulation changes in the winter lower atmosphere and long-lasting solar/geomagnetic activityBochnicek et al. 2012 Ann. Geophys. 30, 1719-1726The paper describes the association between high long-lasting solar/geomagnetic activity and geopotential height (GPH) changes in the winter lower atmosphere, based on their development in the Northern Hemisphere in the winter periods (December-March) of 1950-1969 and 1970-2002. Solar/geomagnetic activity is characterised by the 60-day mean of the sunspot number R/by the 60-day mean of the daily sum of the Kp index. The GPH distributions in the lower atmosphere are described by 60-day anomalies from their long-term daily average at 20 hPa/850 hPa. The data have been adopted from the NCEP/NCAR reanalysis. The 60-day mean values of solar/geomagnetic activity and GPH anomalies were calculated in five-day steps over the whole winter period. The analysis was carried out using composite maps which represent their distribution of the GPH anomalies during high solar activity (R > 100) and high geomagnetic activity ( Kp > 20). Analysis has shown that the dis- tribution of GPH anomalies depends on solar activity, geo-magnetic activity and the phase of winter period (early or late winter). The nature of this relationship then depends on the time interval involved, i.e. 1950-1969 or 1970-2002. Positive anomalies in the polar stratosphere (20 hPa) were detected during the whole winter periods of the years 1950-1969. Significant anomalies were detected in the lower tropo- sphere (850 hPa) during the second half of the winter period. The distribution of GPH anomalies on the maps compiled with regard to solar activity was similar to the distribution on maps compiled with regard to geomagnetic activity. In the interval 1970-2002, significant negative GPH anomalies were detected in the stratosphere at high latitudes, and positive anomalies were detected in the region of low latitudes. The distribution of GPH anomalies in the lower troposphere was substantially affected by situations in which, together with high solar activity, also high geomagnetic activity occurred. Orbital and solar forcing of shifts in Mid- to Late Holocene flood intensity from varved sediments of pre-alpine Lake Ammersee (southern Germany)Czymzik et al. 2013 Quaternary Science Reviews 61, 96-110Microfacies analyses and X-ray fluorescence scanning (u-XRF) at sub-mm resolution were conducted on the varved Mid- to Late Holocene interval of two sediment profiles from pre-alpine Lake Ammersee (southern Germany). The coring sites are located in a proximal (AS10prox) and distal (AS10dist) position towards the main tributary River Ammer, in 1.8 km distance from each other. To shed light on sediment distribution within the lake, particular emphasis was (1) the detection of intercalated detrital layers and their micro-sedimentological features, and (2) intra-basin correlation of these event deposits. Detrital layers were dated by microscopic varve counting, verified by accelerator mass spectrometry 14C dating of terrestrial plant macrofossils. Since c. 5500 varve years (vyr) BP, in total 1573 detrital layers were detected in either one or both of the investigated sediment profiles. Based on their microfacies, geochemistry, and proximal-distal deposition pattern, detrital layers were interpreted as River Ammer flood deposits. Earlier studies on flood layer seasonality have proven that flood layer deposition occurs predominantly during spring and summer, the flood season at Lake Ammersee. Most prominent features of the record are the onset of regular flood layer deposition at c. 5500 vyr BP in AS10prox and c. 2800 vyr BP in AS10dist as well as three major increases in mean flood layer thickness at c. 5500, 2800, and 400 vyr BP. Integrating information from both sediment profiles allowed to interpret these changes in terms of shifts towards higher mean flood intensity. Proposed triggering mechanisms are gradual reduction in Northern Hemisphere orbital summer forcing and superimposed centennial-scale solar activity minima. Likely responses to this forcing are enhanced equator-to-pole temperature gradients and changes in synoptic-scale atmospheric circulation. The consequences for the Ammersee region are more intense cyclones leading to extremer rainfall and flood events in spring and summer. Vísindagreinar frá árinu 2012Statistical tests for a correlation between decadal variation in June precipitation in China and sunspot numberWang and Zhao 2012 Journal of Geophysical Research 117, D23117Six different statistical methods (i.e., correlation, difference, prominent period, variance contribution, scale-averaged spectrum, and cross spectrum) are used to test for regional differences in the relationship between the 11 year sunspot cycle and June precipitation in China during the 20th century. In the Huaihe River basin (HRB) of central China, located at the marginal region of the East Asian summer monsoon (EASM), there exists a reliable positive-correlation relationship between the 11 year sunspot cycle and June precipitation; whereas, possible negative and very weak positive correlations in the south of the middle-lower Yangtze River Region and the HeTao Basin (HTB), located in the interior of the EASM and the westerlies, respectively. The reasons for these regional differences are investigated, revealing that the marginal region of EASM may be more sensitive to solar forcing than is its interior, which results in the HRB becoming the most susceptible (strongest correlation) region. That is to say, in June during the high sunspot number (SSN) years, the influence of the EASM is significantly greater and more to the north than that in June during the low SSN years, causing the HRB to be mainly influenced by the EASM (westerlies) in June during the high (low) SSN years. The northward expansion of the June EASM probably resulted from enhancement of the low-level southwesterly monsoon flow over the northern tropical Indian Ocean, combined with an expansion of the western Pacific subtropical high at times of high SSN. Solar Irradiance Modulation of Equator-to-Pole (Arctic) Temperature Gradients: Empirical Evidence for Climate Variation on Multi-decadal TimescalesSoon and Legates, in press Journal of Atmospheric and Solar-Terrestrial PhysicsUsing thermometer air temperature records for the period 1850 to 2010, we present empirical evidence for a direct relationship between total solar irradiance (TSI) and the Equator-to-Pole (Arctic) surface temperature gradient (EPTG). Modulation of the EPTG by TSI is also shown to exist, in variable ways, for each of the four seasons. Interpretation of the positive relationship between the TSI and EPTG indices suggests that solar-forced changes in the EPTG may represent a hemispheric-scale relaxation response of the system to a reduced Equator-to-Pole temperature gradient, which occurs in response to an increasing gradient of incoming solar insolation. Physical bases for the TSI-EPTG relationship are discussed with respect to their connections with large-scale climate dynamics, especially a critical relationship with the total meridional poleward energy transport. Overall, evidence suggests that a net increase in the TSI, or in the projected solar insolation gradient which reflects any net increase in solar radiation, has caused an increase in both oceanic and atmospheric heat transport to the Arctic in the warm period since the 1970s, resulting in a reduced temperature gradient between the Equator and the Arctic. We suggest that this new interpretative framework, which involves the extrinsic modulation of the total meridional energy flux beyond the implicit assumptions of the Bjerknes Compensation rule, may lead to a better understanding of how global and regional climate has varied through the Holocene and even the Quaternary (the most recent 2.6 million years of Earth's history). Similarly, a reassessment is now required of the underlying mechanisms that may have governed the equable climate dynamics of the Eocene (35 to 55 million years ago) and late Cretaceous (65 to 100 million years ago), both of which were warm geological epochs. This newly discovered relationship between TSI and the EPTG represents the "missing link" that was implicit in the empirical relationship that Soon (2009) recently demonstrated to exist between multi-decadal TSI and Arctic and North Atlantic climatic change. Tracing the response of climate to galactic cosmic raysMiyahara et al. 2012 PAGES News 20, 80-81Anomalous changes in the heliospheric environment and incident cosmic rays during the Maunder Minimum in the 17th century may enable us to understand the impact of galactic cosmic rays on Earth's climate system. Solar Forcing - a new PAGES Working GroupBeer, 2012 PAGES News 20, 91
A cosmic ray-climate link and cloud observationsLaken et al. 2012 J. Space Weather Space Clim. 2, A18Despite over 35 years of constant satellite-based measurements of cloud, reliable evidence of a long-hypothesized link between changes in solar activity and Earth's cloud cover remains elusive. This work examines evidence of a cosmic ray cloud link from a range of sources, including satellite-based cloud measurements and long-term ground-based climatological measurements. The satellite-based studies can be divided into two categories: (1) monthly to decadal timescale analysis and (2) daily timescale epoch-superpositional (composite) analysis. The latter analyses frequently focus on sudden high-magnitude reductions in the cosmic ray flux known as Forbush Decrease events. At present, two long-term independent global satellite cloud datasets are available (ISCCP and MODIS). Although the differences between them are considerable, neither shows evidence of a solar-cloud link at either long or short timescales. Furthermore, reports of observed correlations between solar activity and cloud over the 1983-1995 period are attributed to the chance agreement between solar changes and artificially induced cloud trends. It is possible that the satellite cloud datasets and analysis methods may simply be too insensitive to detect a small solar signal. Evidence from ground-based studies suggests that some weak but statistically significant cosmic ray-cloud relationships may exist at regional scales, involving mechanisms related to the global electric circuit. However, a poor understanding of these mechanisms and their effects on cloud makes the net impacts of such links uncertain. Regardless of this, it is clear that there is no robust evidence of a widespread link between the cosmic ray flux and clouds. Statistics of Solar Cycle-La Niña Connection: Correlation of Two Autocorrelated Time SeriesHaam and Tung 2012 J. Atmos. Sci. 69, 2934-2939Both the 11-yr solar cycle and the El Niño-Southern Oscillation (ENSO) phenomena are quasi periodic, with periods of 9-11 and 3-4 yr, respectively. There have been claims that the two are correlated, with the sun at its peak in sunspot number presumably forcing a cold event in the equatorial Pacific. However, both phenomena are also highly autocorrelated. Caution should be exercised when testing for the statistical significance of the correlation of two autocorrelated time series. The solar peak years can coincide with cold ENSO by chance, even if the two time series are independent, and the coincidence then persists for many cycles due to their autocorrelation, before drifting apart. This study demonstrates that this is indeed the case using the Quinn El Niño index (1525-1987), which is a chronicle of observations of El Niño-related events, and the sunspot number (SSN) series going back to 1750. Appropriate statistical tests are suggested that can test for correlation, taking into account autocorrelation applicable to the shorter instrumental records. There is so far no solar peak-La Niña connection found that is statistically significant. The enigmatic 1,500-year cycleMuscheler 2012 Nature GeoscienceSolar forcing has been invoked to explain persistent, millennial-scale climate variations during the Holocene. Two climate reconstructions, one based on sea-ice drift and one on North Atlantic storminess, call this link into question. Persistent non-solar forcing of Holocene storm dynamics in coastal sedimentary archivesSorrel et al. 2012 Nature GeoscienceConsiderable climatic variability on decadal to millennial timescales has been documented for the past 11,500 years of interglacial climate. This variability has been particularly pronounced at a frequency of about 1,500 years, with repeated cold intervals in the North Atlantic. However, there is growing evidence that these oscillations originate from a cluster of different spectral signatures, ranging from a 2,500-year cycle throughout the period to a 1,000-year cycle during the earliest millennia. Here we present a reappraisal of high-energy estuarine and coastal sedimentary records from the southern coast of the English Channel, and report evidence for five distinct periods during the Holocene when storminess was enhanced during the past 6,500 years. We find that high storm activity occurred periodically with a frequency of about 1,500 years, closely related to cold and windy periods diagnosed earlier. We show that millennial-scale storm extremes in northern Europe are phase-locked with the period of internal ocean variability in the North Atlantic of about 1,500 years. However, no consistent correlation emerges between spectral maxima in records of storminess and solar irradiation. We conclude that solar activity changes are unlikely to be a primary forcing mechanism of millennial-scale variability in storminess. 1,500-year cycle in the Arctic Oscillation identified in Holocene Arctic sea-ice driftDarby et al. 2012 Nature GeoscienceWeather and climate in the Northern Hemisphere is profoundly affected by the Arctic Oscillation, a quasi-periodic fluctuation in atmospheric pressure that occurs on interannual to interdecadal timescales. Reconstructions of the Arctic Oscillation over longer timescales have suggested additional centennial- to millennial-scale variations in the phase of the oscillation, but often with conflicting results. Here we assess patterns of sea-ice drift in the Arctic Ocean over the past 8,000 years by geochemically determining the source of ice-rafted iron grains in a sediment core off the coast of Alaska. We identify pulses of sediment carried by sea ice from the Kara Sea, which can reach the coast of Alaska only during a strongly positive Arctic Oscillation. On the basis of these observations, we construct a record of the Arctic Oscillation phase, and identify a 1,500-year periodicity similar to that found in Holocene records of ice-rafted debris in the North Atlantic, distinct from a 1,000-year cycle that has been found in total solar irradiance. We conclude that the 1,500-year cycle in the Arctic Oscillation arises from either internal variability of the climate system or as an indirect response to low-latitude solar forcing. Anomalous 10Be spikes during the Maunder Minimum: Possible evidence for extreme space weather in the heliosphereKataoka et al. 2012 SPACE WEATHER: THE INTERNATIONAL JOURNAL OF RESEARCH AND APPLICATIONS 10, S11001Extreme space weather conditions pose significant problems for standard space weather models, which are available for some limited realistic parameter ranges. As a good example, anomalous spikes of cosmic ray induced 10Be have been found during the Maunder Minimum (AD1645-1715) at the qA negative solar minima, which cannot be quantitatively explained by standard drift theories of cosmic ray transport alone. Such an extreme amplification of solar cycle modulation of cosmic rays is presumably related to the altered condition of heliospheric environment at the prolonged sunspot disappearance, providing a clue for comprehensive understandings of long-term changes in heliospheric environment, solar cycle modulation of cosmic rays, and the maximal range of incident cosmic ray flux that is very important for our practical space activities. Model sophistication to achieve precise forecast of such extreme condition of the heliosphere and the incoming cosmic ray flux is also of urgent need as the Sun is currently showing a tendency toward lower activity. Here we show that the cosmic ray spikes found at the Maunder Minimum may be explained by the contribution from the cross-sector transport mechanism working in the heliosheath where cosmic ray particles effectively drift across stacked magnetic sectors due to the larger cyclotron radius than the distance between the sectors. Based on the new interpretation of the 10Be record, we clarify potentially important problems for space weather modelers to help with more realistic modeling of the heliosphere during periods of extremely weak solar activity, such as the Maunder Minimum. Early Holocene aeolian dust accumulation in northeast China recorded in varved sediments from Lake SihailongwanZhu et al. Quaternary International, in pressAnnually laminated sediments of Lake Sihailongwan (SHL) in northeast China preserve a high resolution record of past climatic and environmental changes. Thin sections of varved early Holocene sediments were analyzed using light optical and scanning electron microscopic methods. Sediment micro-facies and geochemical analyses reveal two different seasonal clastic layer types: spring snow melt and dust layers. Dust layers distinctly differ from snow melt layers through their finer grain size, better sorting, higher Al and lower Mg and Ca contents. In contrast to recent Lake SHL sediments, during the early Holocene silt- sized dust has been deposited after spring snow melt and after pronounced spring diatom blooms. For the time interval between 11,580 and 7060 varve years BP dust layers were quantified at annual resolution. Highest intensities and frequencies of dust accumulation are observed in the period from 11,100 to 8200 varve years BP, in good agreement with dry conditions in this time interval documented by palaeoclimatic records derived from lake sediments and loess in central Asia and northern China. Based on modern meteorological observation of dust storms in China, the dust accumulation record mirrors mainly the variation in climatic conditions governing generation of cyclone and cold air surges in the arid and semi-arid mid-latitude regions of China and Mongolia. On multidecadal and centennial time scales, solar activity might have been an additional forcing factor for dust accumulation frequency in the early Holocene. Spectral analyses reveal 205-years and 88-years periodicities in variations of dust accumulation frequency that likely reflect the de Vries (Suess) and the Gleissberg solar cycles. Ocean temperature response to idealized Gleissberg and de Vries solar cycles in a comprehensive climate modelSeidenglanz et al. 2012 Geophysical Research LettersThe ~90-year Gleissberg and ~200-year de Vries cycles have been identified as two distinctive quasi-periodic components of Holocene solar activity. Evidence exists for the impact of such multi-decadal to centennial-scale variability in total solar irradiance (TSI) on climate, but concerning the ocean, this evidence is mainly restricted to the surface response. Here we use a comprehensive global climate model to study the impact of idealized solar forcing, representing the Gleissberg and de Vries cycles, on global ocean potential temperature at different depth levels, after a recent proxy record indicates a signal of TSI anomalies in the northeastern Atlantic at mid-depth. Potential impacts of TSI anomalies on deeper oceanic levels are climatically relevant due to their possible effect on ocean circulation by altering water mass characteristics. Simulated solar anomalies are shown to penetrate the ocean down to at least deep-water levels. Despite the fact that the two forcing periods differ only by a factor of ~2, the spatial pattern of response is significantly distinctive between the experiments, suggesting different mechanisms for solar signal propagation. These are related to advection by North Atlantic Deep Water flow (200-year forcing), and barotropic adjustment in the South Atlantic in response to a latitudinal shift of the westerly wind belt (90-year forcing). Is there a planetary influence on solar activity?Abreu et al. 2012 Astronomy & Astrophysics (Open Access)Context. Understanding the Sun's magnetic activity is important because of its impact on the Earth's environment. Direct observations of the sunspots since 1610 reveal an irregular activity cycle with an average period of about 11 years, which is modulated on longer timescales. Proxies of solar activity such as 14 C and 10 Be show consistently longer cycles with well-defined periodicities and varying amplitudes. Current models of solar activity assume that the origin and modulation of solar activity lie within the Sun itself; however, correlations between direct solar activity indices and planetary configurations have been reported on many occasions. Since no successful physical mechanism was suggested to explain these correlations, the possible link between planetary motion and solar activity has been largely ignored. Solar forcing of climate during the last millennium recorded in lake sediments from northern SwedenKokfelt and Muscheler 2012 The HoloceneWe report on a sediment record from a small lake within the subarctic wetland complex Stordalen in northernmost Sweden covering the last 1000 years. Variations in the content of minerogenic material are found to follow reconstructed variations in the activity of the Sun between the 13th and 18th centuries. Periods of low solar activity are associated with minima in minerogenic material and vice versa. A comparison between the sunspot cycle and a long instrumental series of summer precipitation further reveals a link between the 11 yr solar cycle and summer precipitation variability since around 1960. Solar minima are in this period associated with minima in summer precipitation, whereas the amount of summer precipitation increases during periods with higher solar activity. Our results suggest that the climate responds to both the 11 yr solar cycle and to long-term changes in solar activity and in particular solar minima, causing dry conditions with resulting decreased runoff. Impact of solar-induced stratospheric ozone decline on Southern Hemisphere westerlies during the Late Maunder MinimumVarma et al. 2012 Geophysical Research Letters 39, L20704The Southern Hemisphere Westerly Winds (SWW) constitute an important zonal circulation system that dominates the dynamics of the Southern Hemisphere mid-latitudes. In the present study, we analyze results from two transient simulations (1630-2000 AD) conducted with the coupled atmosphere-ocean model EGMAM (ECHO-G with Middle Atmosphere Model): one simulation with fixed stratospheric ozone concentration, and one with solar-induced variations in stratospheric ozone content. The results suggest that during periods of lower solar activity, the annual-mean SWW tend to get weaker on their poleward side and shift towards the equator. The SWW shift is more intense and robust for the simulation with varying stratospheric ozone, suggesting an important influence of solar-induced stratospheric ozone variations on mid-latitude troposphere dynamics. Finally, we present proxy evidence from a high-resolution marine sediment core from the Chilean continental slope (41S), which strongly supports the model result of an equatorward displacement of the SWW during the Maunder Minimum. Persistent solar signatures in cloud cover: spatial and temporal analysisVoiculescu and Usoskin 2012 Environmental Research Letters 7, 044004A consensus regarding the impact of solar variability on cloud cover is far from being reached. Moreover, the impact of cloud cover on climate is among the least understood of all climate components. This motivated us to analyze the persistence of solar signals in cloud cover for the time interval 1984-2009, covering two full solar cycles. A spatial and temporal investigation of the response of low, middle and high cloud data to cosmic ray induced ionization (CRII) and UV irradiance (UVI) is performed in terms of coherence analysis of the two signals. For some key geographical regions the response of clouds to UVI and CRII is persistent over the entire time interval indicating a real link. In other regions, however, the relation is not consistent, being intermittent or out of phase, suggesting that some correlations are spurious. The constant in phase or anti-phase relationship between clouds and solar proxies over some regions, especially for low clouds with UVI and CRII, middle clouds with UVI and high clouds with CRII, definitely requires more study. Our results show that solar signatures in cloud cover persist in some key climate-defining regions for the entire time period and supports the idea that, if existing, solar effects are not visible at the global level and any analysis of solar effects on cloud cover (and, consequently, on climate) should be done at the regional level. How the inclination of Earth's orbit affects incoming solar irradianceVieira et al. 2012 Geophysical Research Letters 39, L16104The variability in solar irradiance, the main external energy source of the Earth's system, must be critically studied in order to place the effects of human-driven climate change into perspective and allow plausible predictions of the evolution of climate. Accurate measurements of total solar irradiance (TSI) variability by instruments onboard space platforms during the last three solar cycles indicate changes of approximately 0.1% over the sunspot cycle. Physics-based models also suggest variations of the same magnitude on centennial to millennia time-scales. Additionally, long-term changes in Earth's orbit modulate the solar irradiance reaching the top of the atmosphere. Variations of orbital inclination in relation to the Sun's equator could potentially impact incoming solar irradiance as a result of the anisotropy of the distribution of active regions. Due to a lack of quantitative estimates, this effect has never been assessed. Here, we show that although observers with different orbital inclinations experience various levels of irradiance, modulations in TSI are not sufficient to drive observed 100 kyr climate variations. Based on our model we find that, due to orbital inclination alone, the maximum change in the average TSI over timescales of kyrs is c0.003 Wm2, much smaller than the c1.5 Wm2 annually integrated change related to orbital eccentricity variations, or the 1-8 Wm2 variability due to solar magnetic activity. Here, we stress that out-of-ecliptic measurements are needed in order to constrain models for the long-term evolution of TSI and its impact on climate. Past millennial solar forcing magnitude - A statistical hemispheric-scale climate model versus proxy data comparisonHind and Moberg 2012 Climate DynamicsA set of global climate model simulations for the last thousand years developed by the Max Planck Institute is compared with paleoclimate proxy data and instrumental data, focusing on surface temperatures for land areas between 30 and 75 N. The proxy data are obtained from six previously published Northern Hemispheric-scale temperature reconstructions, here re-calibrated for consistency, which are compared with the simulations utilizing a newly developed statistical framework for ranking several competing simulations by means of their statistical distance against past climate variations. The climate model simulations are driven by either "low" or "high" solar forcing amplitudes (0.1 and 0.25% smaller total solar irradiance in the Maunder Minimum period compared to the present) in addition to several other known climate forcings of importance. Our results indicate that the high solar forcing amplitude results in a poorer match with the hemispheric-scale temperature reconstructions and lends stronger statistical support for the low-amplitude solar forcing. However, results are likely conditional upon the sensitivity of the climate model used and strongly dependent on the choice of temperature reconstruction, hence a greater consensus is needed regarding the reconstruction of past temperatures as this currently provides a great source of uncertainty. Solar Dynamo Transitions as Drivers of Sudden Climate ChangesDuhau 2012 Global Warming - Impacts and Future PerspectivesThere is a consensus about the origin of the increase of global surface temperature of the 20th century is the fast process of industrialization, that is producing an exponential increase in CO2 and other greenhouse gases in the boundary layer of the Earth atmosphere. However at 1924 a transition to a new configuration of the solar dynamo system occurred that seated this system in the XX century Grand Maximum at which the highest values of solar activity of the last 400 years occurred. Therefore, the sharp increase of global temperature has been not only synchronic with the fast process of industrialization but also with a sudden increase of solar activity. Theories of the Solar Cycle and Its Effect on ClimateSpruit 2012 Prog. Theor. Phys. Supplement 195, 185-200In the first part, some views of the solar magnetic cycle are discussed and confronted with observations, with focus on two aspects at the core of most models: the role of convective turbulence, and the role of the 'tachocline' at the base of the convection zone. The shorter second part discusses the possibility that the magnetic field of the Sun might influence its brightness enough to have an effect on the Earth's climate. The standard view, which treats the solar cycle as a result of the interaction between turbulent convection and magnetic fields is shown to be misplaced. The main ingredient of the solar cycle, apart from differential rotation, is instead buoyant instability of the magnetic field itself. The source of the magnetic field of the solar cycle is usually assumed to be located in the 'tachocline': the shear zone at the base of the convection zone. The cycle cannot be powered by the radial shear of the tachocline as assumed in these models, however, since the radiative interior does not support significant shear stresses. Instead, it must be powered by the latitudinal gradient of the rotation rate in the convection zone, as in early models of the solar cycle. The Sun's brightness is known to vary in sync with the sunspot cycle, but our understanding of the mechanisms involved make it unlikely that it has a significant effect on climate, whether on short (decades) or longer time scales. New detailed Holocene paleomagnetic records with anomalous geomagnetic field behavior in ArgentinaNami, 2012 GEOACTA 37(2): 83-116Detailed palaeomagnetic studies were performed in several archaeological and geological sections dated with diverse relative and absolute methods. Data from 360 cores obtained in eight sites across eastern Argentina are reported. Characteristic remanence magnetization directions were determined by progressive alternating field demagnetization. Remanence directions showed anomalous geomagnetic field behavior far from the present magnetic field bearing oblique normal, oblique reverse and reverse polarities for the latest Pleistocene and Holocene, as well as evidence of possible field excursions recorded in several stratigraphic sections spanning ~11-0.5 kya. Computed virtual geomagnetic poles from those directions tend to be concentrated over North America, Europe, Eastern Asia, Africa and Australia. The hypothesis of the anomalous geomagnetic field directions is probably related with C fluctuations and solar activity. Solar influence on winter severity in central EuropeSirocko et al. 2012 Geophysical Research Letters 39, L16704The last two winters in central Europe were unusually cold in comparison to the years before. Meteorological data, mainly from the last 50 years, and modelling studies have suggested that both solar activity and El Niño strength may influence such central European winter coldness. To investigate the mechanisms behind this in a statistically robust way and to test which of the two factors was more important during the last 230 years back into the Little Ice Age, we use historical reports of freezing of the river Rhine. The historical data show that 10 of the 14 freeze years occurred close to sunspot minima and only one during a year of moderate El Niño. This solar influence is underpinned by corresponding atmospheric circulation anomalies in reanalysis data covering the period 1871 to 2008. Accordingly, weak solar activity is empirically related to extremely cold winter conditions in Europe also on such long time scales. This relationship still holds today, however the average winter temperatures have been rising during the last decades. The long sunspot cycle 23 predicts a significant temperature decrease in cycle 24Solheim et al. 2012 Journal of Atmospheric and Solar-Terrestrial Physics 80, 267-284Relations between the length of a sunspot cycle and the average temperature in the same and the next cycle are calculated for a number of meteorological stations in Norway and in the North Atlantic region. No significant trend is found between the length of a cycle and the average temperature in the same cycle, but a significant negative trend is found between the length of a cycle and the temperature in the next cycle. This provides a tool to predict an average temperature decrease of at least 1.0C from solar cycle 23 to solar cycle 24 for the stations and areas analyzed. We find for the Norwegian local stations investigated that 25-56% of the temperature increase the last 150 years may be attributed to the Sun. For 3 North Atlantic stations we get 63-72% solar contribution. This points to the Atlantic currents as reinforcing a solar signal. The effects of changing solar activity on climate: contributions from palaeoclimatological studiesEngels & van Geel 2012 J. Space Weather Space Clim. 2 A09Natural climate change currently acts in concert with human-induced changes in the climate system. To disentangle the natural variability in the climate system and the human-induced effects on the global climate, a critical analysis of climate change in the past may offer a better understanding of the processes that drive the global climate system. In this review paper, we present palaeoclimatological evidence for the past influence of solar variability on Earth's climate, highlighting the effects of solar forcing on a range of timescales. On a decadal timescale, instrumental measurements as well as historical records show the effects of the 11-year Schwabe cycle on climate. The variation in total solar irradiance that is associated with a Schwabe cycle is only c. 1 W/m2 between a solar minimum and a maximum, but winter and spring temperatures on the Northern Hemisphere show a response even to this small-scale variability. There is a large body of evidence from palaeoclimatic reconstructions that shows the influence of solar activity on a centennial to millennial timescale. We highlight a period of low solar activity starting at 2800 years before present when Europe experienced a shift to colder and wetter climate conditions. The spatial pattern of climate change that can be recognized in the palaeoclimatological data is in line with the suggested pattern of climate change as simulated by climate models. Millennial-scale climate oscillations can be recognized in sediment records from the Atlantic Ocean as well as in records of lake-level fluctuations in southeastern France. These oscillations coincide with variation in 14C production as recognized in the atmospheric 14C record (which is a proxy-record for solar activity), suggesting that Earth's climate is sensitive to changes in solar activity on a millennial timescale as well. Solar forcing of Florida Straits surface salinity during the early HoloceneSchmidt et al. 2012 PaleoceanographyPrevious studies showed that sea surface salinity (SSS) in the Florida Straits [Lund and Curry, 2006] as well as Florida Current transport [Lund et al., 2006] covaried with changes in North Atlantic climate over the past two millennia. However, little is known about earlier Holocene hydrographic variability in the Florida Straits. Here, we combine Mg/Ca-paleothermometry and stable oxygen isotope measurements on the planktonic foraminifera Globigerinoides ruber (white variety) from Florida Straits sediment core KNR166-2 JPC 51 (24 24.70' N, 83 13.14' W, 198 m deep) to reconstruct a high-resolution (~25 yr/sample) early to mid Holocene record of sea surface temperature and d18OSW (a proxy for SSS) variability. After removing the influence of global d18OSW change due to continental ice volume variability, we find that early Holocene SSS enrichments are associated with increased evaporation/precipitation ratios in the Florida Straits during periods of reduced solar forcing [Reimer et al., 2004], increased ice rafted debris in the North Atlantic [Bond et al., 2001] and the development of more permanent El Nino-like conditions in the eastern equatorial Pacific [Marchitto et al., 2010]. When considered with previous high-resolution reconstructions of Holocene tropical atmospheric circulation changes, our results provide evidence that variations in solar forcing over the early Holocene had a significant impact on the global tropical hydrologic cycle. Sudden transitions and grand variations in the solar dynamo, past and futureDe Jager & Duhau 2012 J. Space Weather Space Climate 2, A07The solar dynamo is the exotic dance of the sun's two major magnetic field components, the poloidal and the toroidal, interacting in anti-phase. On the basis of new data on the geomagnetic aa index, we improve our previous forecast of the properties of the current Schwabe cycle #24. Its maximum will occur in 2013.5 and the maximum sunspot number Rmax will then be 62 ± 12, which is within the bounds of our earlier forecasts. The subsequent analysis, based on a phase diagram, which is a diagram showing the relation between maximum sunspot numbers and minimum geomagnetic aa index values leads to the conclusion that a new Grand Episode in solar activity has started in 2008. From the study of the natural oscillations in the sunspot number time series, as found by an analysis based on suitable wavelet base functions, we predict that this Grand Episode will be of the Regular Oscillations type, which is the kind of oscillations that also occurred between 1724 and 1924. Previous expectations of a Grand (Maunder-type) Minimum of solar activity cannot be supported. We stress the significance of the Hallstatt periodicity for determining the character of the forthcoming Grand Episodes. No Grand Minimum is expected to occur during the millennium that has just started. Does the Sun work as a nuclear fusion amplifier of planetary tidal forcing? A proposal for a physical mechanism based on the mass-luminosity relationScafetta 2012 Journal of Atmospheric and Solar-Terrestrial Physics 81-82, 27-40Numerous empirical evidences suggest that planetary tides may influence solar activity. In particular, it has been shown that: (1) the well-known 11-year Schwabe sunspot number cycle is constrained between the spring tidal period of Jupiter and Saturn, c.9.93 year, and the tidal orbital period of Jupiter, c.11.86 year, and a model based on these cycles can reconstruct solar dynamics at multiple time scales (Scafetta, in press); (2) a measure of the alignment of Venus, Earth and Jupiter reveals quasi 11.07-year cycles that are well correlated to the 11-year Schwabe solar cycles; and (3) there exists a 11.08 year cyclical recurrence in the solar jerk-shock vector, which is induced mostly by Mercury and Venus. However, Newtonian classical physics has failed to explain the phenomenon. Only by means of a significant nuclear fusion amplification of the tidal gravitational potential energy dissipated in the Sun, may planetary tides produce irradiance output oscillations with a sufficient magnitude to influence solar dynamo processes. Here we explain how a first order magnification factor can be roughly calculated using an adaptation of the well-known mass-luminosity relation for main-sequence stars similar to the Sun. This strategy yields a conversion factor between the solar luminosity and the potential gravitational power associated to the mass lost by nuclear fusion: the average estimated amplification factor is A=4.25x10⁶. We use this magnification factor to evaluate the theoretical luminosity oscillations that planetary tides may potentially stimulate inside the solar core by making its nuclear fusion rate oscillate. By converting the power related to this energy into solar irradiance units at 1 AU we find that the tidal oscillations may be able to theoretically induce an oscillating luminosity increase from 0.05-0.65 W/m2 to 0.25-1.63 W/m2, which is a range compatible with the ACRIM satellite observed total solar irradiance fluctuations. In conclusion, the Sun, by means of its nuclear active core, may be working as a great amplifier of the small planetary tidal energy dissipated in it. The amplified signal should be sufficiently energetic to synchronize solar dynamics with the planetary frequencies and activate internal resonance mechanisms, which then generate and interfere with the solar dynamo cycle to shape solar dynamics, as further explained in Scafetta (in press). A section is devoted to explain how the traditional objections to the planetary theory of solar variation can be rebutted. A signature of cosmic-ray increase in ad 774-775 from tree rings in JapanMiyake et al. 2012 NatureIncreases in 14C concentrations in tree rings could be attributed to cosmic-ray events, as have increases in 10Be and nitrate in ice cores. The record of the past 3,000 years in the IntCal09 data set10, which is a time series at 5-year intervals describing the 14C content of trees over a period of approximately 10,000 years, shows three periods during which 14C increased at a rate greater than 3permille over 10 years. Two of these periods have been measured at high time resolution, but neither showed increases on a timescale of about 1 year. Here we report 14C measurements in annual rings of Japanese cedar trees from ad 750 to ad 820 (the remaining period), with 1- and 2-year resolution. We find a rapid increase of about 12permille in the 14C content from ad 774 to 775, which is about 20 times larger than the change attributed to ordinary solar modulation. When averaged over 10 years, the data are consistent with the decadal IntCal 14C data from North American and European trees. We argue that neither a solar flare nor a local supernova is likely to have been responsible. The faint young Sun problemFeulner in press Reviews of GeophysicsFor more than four decades, scientists have been trying to find an answer to one of the most fundamental questions in paleoclimatology, the 'faint young Sun problem'. For the early Earth, models of stellar evolution predict a solar energy input to the climate system which is about 25% lower than today. This would result in a completely frozen world over the first two billion years in the history of our planet, if all other parameters controlling Earth's climate had been the same. Yet there is ample evidence for the presence of liquid surface water and even life in the Archean (3.8 to 2.5 billion years before present), so some effect (or effects) must have been compensating for the faint young Sun. A wide range of possible solutions have been suggested and explored during the last four decades, with most studies focussing on higher concentrations of atmospheric greenhouse gases like carbon dioxide, methane or ammonia. All of these solutions present considerable difficulties, however, so the faint young Sun problem cannot be regarded as solved. Here I review research on the subject, including the latest suggestions for solutions of the faint young Sun problem and recent geochemical constraints on the composition of Earth's early atmosphere. Furthermore, I will outline the most promising directions for future research. In particular I would argue that both improved geochemical constraints on the state of the Archean climate system and numerical experiments with state-of-the-art climate models are required to finally assess what kept the oceans on the Archean Earth from freezing over completely. Solar Influence on Global and Regional ClimatesLockwood 2012 Surveys in GeophysicsThe literature relevant to how solar variability influences climate is vast - but much has been based on inadequate statistics and non-robust procedures. The common pitfalls are outlined in this review. The best estimates of the solar influence on the global mean air surface temperature show relatively small effects, compared with the response to anthropogenic changes (and broadly in line with their respective radiative forcings). However, the situation is more interesting when one looks at regional and season variations around the global means. In particular, recent research indicates that winters in Eurasia may have some dependence on the Sun, with more cold winters occurring when the solar activity is low. Advances in modelling "top-down" mechanisms, whereby stratospheric changes influence the underlying troposphere, offer promising explanations of the observed phenomena. In contrast, the suggested modulation of low-altitude clouds by galactic cosmic rays provides an increasingly inadequate explanation of observations. Climate sensitivity to the lower stratospheric ozone variationsKilifarska 2012 Journal of Atmospheric and Solar-Terrestrial PhysicsThe strong sensitivity of the Earth's radiation balance to variations in the lower stratospheric ozone-reported previously-is analysed here by the use of non-linear statistical methods. Our non-linear model of the land air temperature (T)-driven by the measured Arosa total ozone (TOZ)-explains 75% of total variability of Earth's T variations during the period 1926-2011. We have analysed also the factors which could influence the TOZ variability and found that the strongest impact belongs to the multi-decadal variations of galactic cosmic rays. Constructing a statistical model of the ozone variability, we have been able to predict the tendency in the land air T evolution till the end of the current decade. Results show that Earth is facing a weak cooling of the surface T by 0.05-0.25 K (depending on the ozone model) until the end of the current solar cycle. A new mechanism for O3 influence on climate is proposed. Assessment of the relationship between the combined solar cycle/ENSO forcings and the tropopause temperaturePowell Jr and Xu 2012 Journal of Atmospheric and Solar-Terrestrial Physics 80, 21-27The tropopause region of the atmosphere shows large variability over time and by region. The complex changes near the tropopause are not fully understood, especially in terms of interdecadal and interannual forcings. The purpose of this paper is to investigate forcings in the tropopause region by using microwave sounder observations and comparing the results to previous analyses. On the basis of the satellite retrieved temperatures from the Microwave Sounding Unit (MSU) Channel 3 (CH3) measurements which began in 1981 and continue to the current time, this analysis will assess the solar forcing and the El Nino Southern Oscillation (ENSO) forcing within the tropopause layer (300-100 hPa). The temperature variability from the combined "downward" solar forcing and the "upward" ENSO forcing have been investigated using wavelet, multiple linear regression and lag correlation analyses. The results show that the temperature variability within the tropopause layer was dominated by 3.5-7 and 14-28 year oscillations. The temperature responses to the two forcings apparently depend on the location, season and time scale of the measurements. The temperature response to solar forcing can be found over the Arctic and Antarctic zones in winter. On the interdecadal time scale, the temperature response to solar forcing was markedly amplified with a lag of 1-2 years or 5-7 years and was out of phase between the Arctic, and all other latitudes. Interestingly, the statistically significant response to solar forcing was only identified over the tropical central and western Pacific in summer. The temperature response to the ENSO forcing is much stronger than the solar forcing based on the magnitude of the regression coefficients. A significant positive response occurs over most of the tropical ocean areas in winter and a negative temperature response is confined to the tropical western Pacific in summer. On the interannual time scale, the temperature response is observed within the tropical areas and reaches a positive maximum 4-5 months later, and can be identified up to 10 months later with statistically significant values. After 10 months, the response is negative. 10Be in lacustrine sediments-A record of solar activity?Mann et al. 2012 Journal of Atmospheric and Solar-Terrestrial Physics 80, 92-99Concentrations and fluxes of cosmogenic 10Be in three varved lake sediments covering the last 100 years were determined to investigate their suitability to record past solar activity. The 10Be signal in lake sediments is composed of a component reflecting the radionuclide production in the atmosphere and a component related to the subsequent transport into the sediment. In order to separate these two components we applied singular-spectrum analysis (SSA). The extracted patterns in concentrations and depositional fluxes were compared to 10Be records from polar ice cores and to the solar modulation potential derived from neutron monitor data. In the transport component we discovered the existence of a long-term trend in the 10Be concentrations, which can be attributed to the redox cycle of both lakes. In the production component we found a similar pattern as in the NGrip ice core. A cross-correlation analysis yielded a significant negative correlation between the 10Be production component and the solar modulation potential. 10Be lags the production on average by 1.5 years which corresponds to the expected transport time from the atmosphere to the Earth's surface. Hence, we conclude that varved lake sediments are potentially suitable to study the solar activity of the past. However, one should be aware that various mechanisms may mask the 10Be signal in the sediment. Testing an astronomically based decadal-scale empirical harmonic climate model versus the IPCC (2007) general circulation climate modelsScafetta 2012 Journal of Atmospheric and Solar-Terrestrial Physics 80, 124-137We compare the performance of a recently proposed empirical climate model based on astronomical harmonics against all CMIP3 available general circulation climate models (GCM) used by the IPCC (2007) to interpret the 20th century global surface temperature. The proposed astronomical empirical climate model assumes that the climate is resonating with, or synchronized to a set of natural harmonics that, in previous works (Scafetta, 2010b, 2011b), have been associated to the solar system planetary motion, which is mostly determined by Jupiter and Saturn. We show that the GCMs fail to reproduce the major decadal and multidecadal oscillations found in the global surface temperature record from 1850 to 2011. On the contrary, the proposed harmonic model (which herein uses cycles with 9.1, 10-10.5, 20-21, 60-62 year periods) is found to well reconstruct the observed climate oscillations from 1850 to 2011, and it is shown to be able to forecast the climate oscillations from 1950 to 2011 using the data covering the period 1850-1950, and vice versa. The 9.1-year cycle is shown to be likely related to a decadal Soli/Lunar tidal oscillation, while the 10-10.5, 20-21 and 60-62 year cycles are synchronous to solar and heliospheric planetary oscillations. We show that the IPCC GCM's claim that all warming observed from 1970 to 2000 has been anthropogenically induced is erroneous because of the GCM failure in reconstructing the quasi 20-year and 60-year climatic cycles. Finally, we show how the presence of these large natural cycles can be used to correct the IPCC projected anthropogenic warming trend for the 21st century. By combining this corrected trend with the natural cycles, we show that the temperature may not significantly increase during the next 30 years mostly because of the negative phase of the 60-year cycle. If multisecular natural cycles (which according to some authors have significantly contributed to the observed 1700-2010 warming and may contribute to an additional natural cooling by 2100) are ignored, the same IPCC projected anthropogenic emissions would imply a global warming by about 0.3-1.2 °C by 2100, contrary to the IPCC 1.0-3.6 °C projected warming. The results of this paper reinforce previous claims that the relevant physical mechanisms that explain the detected climatic cycles are still missing in the current GCMs and that climate variations at the multidecadal scales are astronomically induced and, in first approximation, can be forecast. Possible evidence of the resonant influence of solar forcing on the climate systemGusev and Martin 2012 Journal of Atmospheric and Solar-Terrestrial Physics 80, 173-178An assumption of the existence of natural climatic oscillations driven by solar activity enables an explanation of phase differences between variations in solar activity and rainfall level in Fortaleza, Brazil. Decadal and interdecadal variations in rainfall level can be reproduced using a forced oscillation equation with a driving force term that describes the variation in the sunspot number and with the assumption of the existence of 31.7-year interdecadal and 12.96-year decadal natural climatic oscillations. This equation satisfactorily reproduces the periodicity with a length of approximately 22 yr in the interdecadal rainfall variation before and up to the middle of the past century as well as the subsequent phase inversion, period and amplitude increase in the variation that followed the corresponding increases in the interdecadal sunspot number variation. The equation accurately reproduces the irregular phase shifts between decadal variations in rainfall level and in sunspot number over the entire 160 yr of recorded observations. A correlation of mean period of MJO indices and 11-yr solar variationBlanter et al. 2012 Journal of Atmospheric and Solar-Terrestrial Physics 80, 195-207This paper focuses on the decadal to multi-decadal evolution of the spectral properties of the Madden-Julian Oscillation (MJO). Guided by former studies, we test whether the c.11-yr (Schwabe) cycle of solar activity could be reflected in the spectral features of MJO indices: namely, we study the evolution of MJO mean period within different period ranges and compare these with the evolution of solar activity. We focus on solar proxies best linked to UV emission and cosmic rays: sunspot number WN, F10.7 flux, core-to-wing ratio MgII, and galactic cosmic rays (GCR). A clear solar signature in MJO spectral properties is indeed found and shown to be both statistically significant and robust. UV proxies are found to be better correlated with MJO mean period than GCR, thus supporting rather the ozone mechanism of solar impact on MJO. The overall correlation with solar activity is found to be stronger in the Indian Ocean. Long periods (e.g. 50-80 day) are better correlated with solar activity than shorter periods (e.g. 30-60 day). A marked change in the relationship between MJO mean period and solar activity takes place in the declining phase of solar cycle 23, adding to its unusual character. Multi-scale harmonic model for solar and climate cyclical variation throughout the Holocene based on Jupiter-Saturn tidal frequencies plus the 11-year solar dynamo cycleScafetta 2012 Journal of Atmospheric and Solar-Terrestrial Physics 80, 296-311The Schwabe frequency band of the Zurich sunspot record since 1749 is found to be made of three major cycles with periods of about 9.98, 10.9 and 11.86 years. The side frequencies appear to be closely related to the spring tidal period of Jupiter and Saturn (range between 9.5 and 10.5 years, and median 9.93 years) and to the tidal sidereal period of Jupiter (about 11.86 years). The central cycle may be associated to a quasi-11-year solar dynamo cycle that appears to be approximately synchronized to the average of the two planetary frequencies. A simplified harmonic constituent model based on the above two planetary tidal frequencies and on the exact dates of Jupiter and Saturn planetary tidal phases, plus a theoretically deduced 10.87-year central cycle reveals complex quasi-periodic interference/beat patterns. The major beat periods occur at about 115, 61 and 130 years, plus a quasi-millennial large beat cycle around 983 years. We show that equivalent synchronized cycles are found in cosmogenic records used to reconstruct solar activity and in proxy climate records throughout the Holocene (last 12,000 years) up to now. The quasi-secular beat oscillations hindcast reasonably well the known prolonged periods of low solar activity during the last millennium such as the Oort, Wolf, Spörer, Maunder and Dalton minima, as well as the 17 115-year long oscillations found in a detailed temperature reconstruction of the Northern Hemisphere covering the last 2000 years. The millennial three-frequency beat cycle hindcasts equivalent solar and climate cycles for 12,000 years. Finally, the harmonic model herein proposed reconstructs the prolonged solar minima that occurred during 1900-1920 and 1960-1980 and the secular solar maxima around 1870-1890, 1940-1950 and 1995-2005 and a secular upward trending during the 20th century: this modulated trending agrees well with some solar proxy model, with the ACRIM TSI satellite composite and with the global surface temperature modulation since 1850. The model forecasts a new prolonged solar minimum during 2020-2045, which would be produced by the minima of both the 61 and 115-year reconstructed cycles. Finally, the model predicts that during low solar activity periods, the solar cycle length tends to be longer, as some researchers have claimed. These results clearly indicate that both solar and climate oscillations are linked to planetary motion and, furthermore, their timing can be reasonably hindcast and forecast for decades, centuries and millennia. The demonstrated geometrical synchronicity between solar and climate data patterns with the proposed solar/planetary harmonic model rebuts a major critique (by Smythe and Eddy, 1977) of the theory of planetary tidal influence on the Sun. Other qualitative discussions are added about the plausibility of a planetary influence on solar activity. Solar forcing of climatede Jager, 2012 Surv GeophysSolar activity is evident both in the equatorial activity centres and in the polar magnetic field variations. The total solar irradiance variation is due to the former com- ponent. During the extraordinarily long minimum of activity between sunspot cycles 23 and 24, the variations related to the equatorial field components reached their minimum values in the first half of 2008, while those related to the polar field variations had their extreme values rather at the end of 2009 and the first half of 2010. The explanation of this delay is another challenge for dynamo theories. The role of the open solar flux has so far been grossly underestimated in discussions of Sun-climate relations. The gradual increase in the average terrestrial ground temperature since 1610 is related both to the equatorial and polar field variations. The main component (0.077 K/century) is due to the variation of the total solar irradiance. The second component (0.040 K/century) waits for an expla- nation. The smoothed residual increase, presumably antropogenic, obtained after sub- traction of the known components from the total increase was 0.31 K in 1999. Discovering the anomalously cold Mediterranean winters during the Maunder minimumDiodato and Bellocchi 2011 The Holocene 22, 589-596This work presents an attempt to reconstruct the Mediterranean Italy climate across one of the coldest interval (ad 1645-1715) of the 'Little Ice Age' (LIA), characterized by a prolonged episode of low solar acitivty known as 'Maunder minimum' (MM). LIA was characterized by marked climatic variability over this part of southern Europe, particularly during the MM. Using a model based on adding subregional details to regional-scale reconstruction, we estimated for this period a mean winter temperature of ~1°C lower than in the baseline period 1961-1990 (~8°C), and the anomaly further lowered down to about -4°C in the winter of 1683-1684. In addition, the interannual variability of extreme low temperatures makes the MM an outstanding climatic period. There is also some consistency of the empirical evidence with the modelling results that, for high-resolution wintertime seasonal reconstruction, central Mediterranean Sub-regional Area shows a colder climate than that represented by coarser simulation of European temperatures during the LIA period. Regional atmospheric circulation shifts induced by a grand solar minimumMartin-Puertas et al. 2012 Nature GeoscienceLarge changes in solar ultraviolet radiation can indirectly affect climate by inducing atmospheric changes. Specifically, it has been suggested that centennial-scale climate variability during the Holocene epoch was controlled by the Sun. However, the amplitude of solar forcing is small when compared with the climatic effects and, without reliable data sets, it is unclear which feedback mechanisms could have amplified the forcing. Here we analyse annually laminated sediments of Lake Meerfelder Maar, Germany, to derive variations in wind strength and the rate of Be-10 accumulation, a proxy for solar activity, from 3,300 to 2,000 years before present. We find a sharp increase in windiness and cosmogenic Be-10 deposition 2,759+-39 varve years before present and a reduction in both entities 199+-9 annual layers later. We infer that the atmospheric circulation reacted abruptly and in phase with the solar minimum. A shift in atmospheric circulation in response to changes in solar activity is broadly consistent with atmospheric circulation patterns in long-term climate model simulations, and in reanalysis data that assimilate observations from recent solar minima into a climate model. We conclude that changes in atmospheric circulation amplified the solar signal and caused abrupt climate change about 2,800 years ago, coincident with a grand solar minimum. Tree ring based precipitation reconstruction in the south slope of the middle Qilian Mountains, northeastern Tibetan Plateau, over the last millenniumSun and Liu 2012 JOURNAL OF GEOPHYSICAL RESEARCH, VOL. 117, D08108A tree ring (Sabina przewalskii Kom.) based millennial precipitation reconstruction on the south slope of the middle Qilian Mountains in the northeastern margin of Tibetan Plateau, China, was completed, which explains 48.5% of the variance in the instrumental precipitation from 1958 to 2004. The long-term precipitation variation patterns were confirmed on the basis of the duration, magnitude, and intensify of the multidecadal dry (wet) events. There are several stronger multidecadal dry periods, 1092-1172, 1441-1517, and 1564-1730, whereas there is only one outstanding severe wet event of 1352-1440. The variations of the precipitation reconstruction are accordant with the glacier accumulation and dust contents of Dunde ice core and also with the variations of the precipitation, runoff, Palmer Drought Severity Index, and tree ring width series in the northeastern Tibetan Plateau. The spatial extent of the great drought in the latter half of the 15th century also concentrated on the northeastern Tibetan Plateau. The moisture variations in the northeastern Tibetan Plateau are synchronous over a large spatial and temporal range in multidecadal scale for the last millennium, especially during dry periods. Wavelet analyses and comparisons with the minimal solar activity show that the precipitation variations for the last millennium may have some association with the solar activity on multidecadal to centennial scales. Evidence of nearby supernovae affecting life on EarthSvensmark 2012 Mon. Not. R. Astron. Soc.Observations of open star clusters in the solar neighbourhood are used to calculate local supernova (SN) rates for the past 510 Myr. Peaks in the SN rates match passages of the Sun through periods of locally increased cluster formation which could be caused by spiral arms of the Galaxy. A statistical analysis indicates that the Solar system has experienced many large short-term increases in the flux of Galactic cosmic rays (GCR) from nearby SNe. The hypothesis that a high GCR flux should coincide with cold conditions on the Earth is borne out by comparing the general geological record of climate over the past 510 Myr with the fluctuating local SN rates. Surprisingly, a simple combination of tectonics (long-term changes in sea level) and astrophysical activity (SN rates) largely accounts for the observed variations in marine biodiversity over the past 510 Myr. An inverse correspondence between SN rates and carbon dioxide (CO2 ) levels is discussed in terms of a possible drawdown of CO2 by enhanced bio-productivity in oceans that are better fertilized in cold conditions - a hypothesis that is not contradicted by data on the relative abundance of the heavy isotope of carbon, 13C. The influence of planetary attractions on the solar tachoclineCallebaut et al. 2012 Journal of Atmospheric and Solar-Terrestrial Physics 80: 73-78We present a physical analysis of the occasionally forwarded hypothesis that solar variability, as shown in the various photospheric and outer solar layer activities, might be due to the Newtonian attraction by the planets. We calculate the planetary forces exerted on the tachocline and thereby not only include the immediate forces but we also take into account that these planetary or dynamo actions occur during some time, which demands integration. As an improvement to earlier research on this topic we reconsider the internal convective velocities and we examine several other effects, in particular those due to magnetic buoyancy and to the Coriolis force. The main conclusion is that in its essence: planetary influences are too small to be more than a small modulation of the solar cycle. We do not exclude the possibility that the long term combined action of the planets may induce small internal motions in the sun, which may have indirectly an effect on the solar dynamo after a long time. 9,400 years of cosmic radiation and solar activity from ice cores and tree ringsSteinhilber et al. 2012 PNASUnderstanding the temporal variation of cosmic radiation and solar activity during the Holocene is essential for studies of the solar-terrestrial relationship. Cosmic-ray produced radionuclides, such as 10 Be and 14 C which are stored in polar ice cores and tree rings, offer the unique opportunity to reconstruct the history of cosmic radiation and solar activity over many millennia. Although records from different archives basically agree, they also show some deviations during certain periods. So far most reconstructions were based on only one single radionuclide record, which makes detection and correction of these deviations impossible. Here we combine different 10 Be ice core records from Greenland and Antarctica with the global 14 C tree ring record using principal component analysis. This approach is only possible due to a new high-resolution 10 Be record from Dronning Maud Land obtained within the European Project for Ice Coring in Antarctica in Antarctica. The new cosmic radiation record enables us to derive total solar irradiance, which is then used as a proxy of solar activity to identify the solar imprint in an Asian climate record. Though generally the agreement between solar forcing and Asian climate is good, there are also periods without any coherence, pointing to other forcings like volcanoes and greenhouse gases and their corresponding feedbacks. The newly derived records have the potential to improve our understanding of the solar dynamics and to quantify the solar influence on climate. Trends in sunspots and North Atlantic sea level pressurevan Loon et al. 2012 Journal of Geophysical Research 117, D07106We analyze the periods 1878-1944 and 1944-2008. The quasi-stationary wave in the North Atlantic region was stronger and the baroclinity steeper in 1878-1944 than in 1944-2008. The North Atlantic Oscillation Index-as defined by the Climate Research Unit, University of East Anglia-was higher in the former period too. We illustrate these statements by maps of sea level pressure and air temperature at the surface. The long-term trends in the North Atlantic Oscillation Index are linked to the trend in sunspot number such that when, in the mean, the sunspot numbers were high (Gleissberg maxima) the trends in the two quantities were parallel; and when the mean sunspot numbers were low (Gleissberg minima) the trends in the North Atlantic Oscillation Index and sunspots were opposite. We find the connections between the trends statistically significant, and we infer that the level of solar activity played a role in the trends of the past two centuries in the North Atlantic region. However, we cannot as yet provide a mechanism linking the solar trends to those in the atmosphere and ocean, but as a step toward an explanation, the equator to pole temperature gradient is steeper in a Gleissberg minimum than in a maximum. Sun-Moon gravitation-induced wave characteristics and climate variationWang et al. 2012 Journal of Geophysical Research 117, D07102Understanding periods associated with climate variations has been challenging and has attracted scientific study. In the work presented here, we establish a theoretical dynamical model driven by Sun-Moon gravitation (SMG) and present basic SMG wave characteristics and SMG-induced nonlinear motions for geophysical fluids. As compared to observations, waves and motions demonstrate climate variations associated with abundant structures and climatic rhythms, including the 30-60 day oscillation, seasonality, El Ninho-Southern Oscillation-like interannual variation, etc. In our work, periods depended upon the obliquity and revolution velocity of the Sun and Moon; the speed of geophysical fluids; and the latitude, radius, and rotation velocity of Earth. The rotation of Earth helps fluids remember and accumulate momentum in geophysical fluids that are provided by the SMG on multiple time scales, which may contribute to multiperiods of climate oscillations. The speed-dependent periods of SMG-induced flow are of a broad spectrum (i.e., faster speeds, shorter periods). SMG-induced flow in an atmosphere of faster flow tends to have shorter (e.g., seasonal and annual) periods, while an ocean of slower flow tends to have longer (e.g., annual and interannual) periods. Strong evidence for the influence of solar cycles on a Late Miocene lake system revealed by biotic and abiotic proxiesKern et al. 2012 Palaeogeography, Palaeoclimatology, Palaeoecology 329-330, 124-136The Late Miocene paleogeography of central Europe and its climatic history are well studied with a resolution of c. 106 years. Small-scale climatic variations are yet unresolved. Observing past climatic change of short periods, however, would encourage the understanding of the modern climatic system. Therefore, past climate archives require a resolution on a decadal to millennial scale. To detect such a short-term evolution, a continuous 6-m-core of the Paleo-Lake Pannon was analyzed in 1-cm-sample distance to provide information as precise and regular as possible. Measurements of the natural gamma radiation and magnetic susceptibility combined with the total abundance of ostracod shells were used as proxies to estimate millennial- to centennial scale environmental changes during the mid-Tortonian warm period. Patterns emerged, but no indisputable age model can be provided for the core, due to the lack of paleomagnetic reversals and the lack of minerals suitable for absolute dating. Therefore, herein we propose another method to determine a hypothetic time frame for these deposits. Based on statistical processes, including Lomb-Scargle and REDFIT periodograms along with Wavelet spectra, several distinct cyclicities could be detected. Calculations considering established off-shore sedimentation rates of the Tortonian Vienna Basin revealed patterns resembling Holocene solar-cycle-records well. The comparison of filtered data of Miocene and Holocene records displays highly similar patterns and comparable modulations. A best-fit adjustment of sedimentation rate results in signals which fit to the lower and upper Gleissberg cycle, the de Vries cycle, the unnamed 500-year- and 1000-year-cycles, as well as the Hallstatt cycle. Each of these cycles has a distinct and unique expression in the investigated environmental proxies, reflecting a complex forcing-system. Hence, a single-proxy-analysis, as often performed on Holocene records, should be considered cautiously as it might fail to capture the full range of solar cycles. Global temperature response to radiative forcing: Solar cycle versus volcanic eruptionsRypdal 2012 JOURNAL OF GEOPHYSICAL RESEARCH 117, D06115I show that the peak-to-peak amplitude of the global mean surface temperature response to the 11-year cyclic total irradiance forcing is an order of magnitude less than the amplitude of a cyclic component roughly in phase with the solar forcing which has been observed in the temperature record in the period 1959-2004. If this cyclic temperature component were a response to the solar forcing, it would imply the existence of strong amplifying feedbacks which operate exclusively for solar forcing, such as top-down mechanisms responding to the large variability in the ultraviolet part of the solar spectrum. I demonstrate, however, that the apparent cyclic component in the temperature record is dominated by the response to five major volcanic eruptions some of which incidentally took place a few years before solar minimum in four consecutive solar cycles, and hence that the correlation with the solar cycle is coincidental. A temperature rise of approximately 0.15 K over the 20th century ascribed to an increasing trend in solar forcing is more than offset by a cooling trend of about 0.3 K due to stratospheric aerosols from volcanic eruptions. The 11 year solar cycle signal in transient simulations from the Whole Atmosphere Community Climate ModelChiodo et al. 2012 JOURNAL OF GEOPHYSICAL RESEARCH 117, D06109The atmospheric response to the 11 year solar cycle (SC) and its combination with the quasi-biennal oscillation (QBO) are analyzed in four simulations of the Whole Atmosphere Community Climate Model version 3.5 (WACCM3.5), which were performed with observed sea surface temperatures, volcanic eruptions, greenhouse gases, and a nudged QBO. The analysis focuses on the annual mean response of the model to the SC and on the evolution of the solar signal during the Northern Hemispheric winter. WACCM3.5 simulates a significantly warmer stratosphere under solar maximum conditions compared to solar minimum. The vertical structure of the signal in temperature and ozone at low latitudes agrees with observations better than previous versions of the model. The temperature and wind response in the extratropics is more uncertain because of its seasonal dependence and the large dynamical variability of the polar vortex. However, all four simulations reproduce the observed downward propagation of zonal wind anomalies from the upper stratosphere to the lower stratosphere during boreal winter resulting from solar-induced modulation of the polar night jet and the Brewer-Dobson circulation. Combined QBO-SC effects in the extratropics are consistent with observations, but they are not robust across the ensemble members. During boreal winter, solar signals are also found in tropospheric circulation and surface temperature. Overall, these results confirm the plausibility of proposed dynamical mechanisms driving the atmospheric response to the SC. The improvement of the model climatology and variability in the polar stratosphere is the basis for the success in simulating the evolution and magnitude of the solar signal. Hydroclimate of the northeastern United States is highly sensitive to solar forcingNichols and Huang 2012 Geophysical Research Letters 39, L04707Dramatic hydrological fluctuations strongly impact human society, but the driving mechanisms for these changes are unclear. One suggested driver is solar variability, but supporting paleoclimate evidence is lacking. Therefore, long, continuous, high-resolution records from strategic locations are crucial for resolving the scientific debate regarding sensitivity of climate to solar forcing. We present a 6800-year, decadally-resolved biomarker and multidecadally-resolved hydrogen isotope record of hydroclimate from a coastal Maine peatland, The Great Heath (TGH). Regional moisture balance responds strongly and consistently to solar forcing at centennial to millennial timescales, with solar minima concurrent with wet conditions. We propose that the Arctic/North Atlantic Oscillation (AO/NAO) can amplify small solar fluctuations, producing the reconstructed hydrological variations. The Sun may be entering a weak phase, analogous to the Maunder minimum, which could lead to more frequent flooding in the northeastern US at this multidecadal timescale. Spring temperature variability relative to the North Atlantic Oscillation and sunspots - A correlation analysis with a Monte Carlo implementationHelama & Holopainen 2012 Palaeogeography, Palaeoclimatology, Palaeoecology 326-328, 128-134A reconstruction of past spring temperatures was analysed and compared to long-term records of the North Atlantic Oscillation (NAO) and sunspots. This palaeoclimate reconstruction, built previously using multiple proxy evidence of historical and natural sources from southwest Finland, explained approx. 70% of the instrumental temperature variance over a spring season (February-June) and covered the time period from 1750 to the present. Correlations between the NAO and sunspots appear markedly high and, based on Monte Carlo tests, statistically significant (p < 0.01) since around 1925. Correlation between sunspots and temperatures appeared notably high over the past 50 years, but this association could not be confirmed by the significance test. Correlations between the NAO and temperatures were high and statistically significant. However, the pre-1860s NAO-temperature correlations were lower than the correlations after that date. Previous studies have emphasized the possibility of enhanced solar forcing on NAO variability over the past 30-40 years broadly operative on decadal scales (with so far unresolved explanatory mechanisms). Our results correlate with this view to a statistically significant extent (p < 0.01) in the context of the past two centuries of regional climate variability. The NAO-temperature correlations were clearly stronger than the correlations between sunspots and temperatures. Moreover, the correlations were stronger between decadally filtered records. Consequently, the potential solar forcing on regional temperatures may have operated on decadal scales and been augmented by the NAO-temperature association. Decadal solar signal in ozone and temperature through the mesosphere of Northern tropicsFadnavis et al. 2012 Journal of Atmospheric and Solar-Terrestrial Physics 78-79, 2-7To investigate the effects of decadal solar variability on ozone and temperature in the mesosphere of the Northern tropics, data obtained from the Halogen Occultation Experiment (HALOE) aboard Upper Atmospheric Research Satellite (UARS) during the period 1992-2005 are analyzed using a multifunctional regression model. The inferred annual-mean solar signal in ozone is found to be insignificant in the lower mesosphere whereas it is of the order of 5%/100 sfu in the upper mesosphere. Seasonal variation of ozone response to solar variability indicates a strong positive response (22-30%/100 sfu) during summer and autumn between 5E-3 and 0.01 mb pressure levels (c.80-85 km). The annual mean temperature response is found to be of the order of 0.5-1 K/100 sfu. Significant positive temperature response is observed during winter and autumn in the lower mesosphere and during summer and spring in the upper mesosphere. Results obtained in the present study are also compared with the results obtained by other workers. High-resolution sea surface reconstructions off Cape Hatteras over the last 10 kaCleroux et al. 2012 Paleoceanography 27, PA1205This study presents high-resolution foraminiferal-based sea surface temperature, sea surface salinity and upper water column stratification reconstructions off Cape Hatteras, a region sensitive to atmospheric and thermohaline circulation changes associated with the Gulf Stream. We focus on the last 10,000 years (10 ka) to study the surface hydrology changes under our current climate conditions and discuss the centennial to millennial time scale variability. We observed opposite evolutions between the conditions off Cape Hatteras and those south of Iceland, known today for the North Atlantic Oscillation pattern. We interpret the temperature and salinity changes in both regions as co-variation of activities of the subtropical and subpolar gyres. Around 8.3 ka and 5.2-3.5 ka, positive salinity anomalies are reconstructed off Cape Hatteras. We demonstrate, for the 5.2-3.5 ka period, that the salinity increase was caused by the cessation of the low salinity surface flow coming from the north. A northward displacement of the Gulf Stream, blocking the southbound low-salinity flow, concomitant to a reduced Meridional Overturning Circulation is the most likely scenario. Finally, wavelet transform analysis revealed a 1000-year period pacing the d 18O signal over the early Holocene. This 1000-year frequency band is significantly coherent with the 1000-year frequency band of Total Solar Irradiance (TSI) between 9.5 ka and 7 ka and both signals are in phase over the rest of the studied period. What influence will future solar activity changes over the 21st century have on projected global near-surface temperature changes?Jones et al. 2012 Journal of Geophysical Research 117, D05103During the 20th century, solar activity increased in magnitude to a so-called grand maximum. It is probable that this high level of solar activity is at or near its end. It is of great interest whether any future reduction in solar activity could have a significant impact on climate that could partially offset the projected anthropogenic warming. Observations and reconstructions of solar activity over the last 9000 years are used as a constraint on possible future variations to produce probability distributions of total solar irradiance over the next 100 years. Using this information, with a simple climate model, we present results of the potential implications for future projections of climate on decadal to multidecadal timescales. Using one of the most recent reconstructions of historic total solar irradiance, the likely reduction in the warming by 2100 is found to be between 0.06 and 0.1 K, a very small fraction of the projected anthropogenic warming. However, if past total solar irradiance variations are larger and climate models substantially underestimate the response to solar variations, then there is a potential for a reduction in solar activity to mitigate a small proportion of the future warming, a scenario we cannot totally rule out. While the Sun is not expected to provide substantial delays in the time to reach critical temperature thresholds, any small delays it might provide are likely to be greater for lower anthropogenic emissions scenarios than for higher-emissions scenarios. Abrupt onset of the Little Ice Age triggered by volcanism and sustained by sea-ice/ocean feedbacksMiller et al. 2012 GRLNorthern Hemisphere summer temperatures over the past 8000 years have been paced by the slow decrease in summer insolation resulting from the precession of the equinoxes. However, the causes of superposed century-scale cold summer anomalies, of which the Little Ice Age (LIA) is the most extreme, remain debated, largely because the natural forcings are either weak or, in the case of volcanism, short lived. Here we present precisely dated records of ice-cap growth from Arctic Canada and Iceland showing that LIA summer cold and ice growth began abruptly between 1275 and 1300 AD, followed by a substantial intensification 1430-1455 AD. Intervals of sudden ice growth coincide with two of the most volcanically perturbed half centuries of the past millennium. A transient climate model simulation shows that explosive volcanism produces abrupt summer cooling at these times, and that cold summers can be maintained by sea-ice/ocean feedbacks long after volcanic aerosols are removed. Our results suggest that the onset of the LIA can be linked to an unusual 50-year-long episode with four large sulfur-rich explosive eruptions, each with global sulfate loading >60 Tg. The persistence of cold summers is best explained by consequent sea-ice/ocean feedbacks during a hemispheric summer insolation minimum; large changes in solar irradiance are not required. Modes of variability of the vertical temperature profile of the middle atmosphere at mid-latitude: Similarities with solar forcingKeckhut et al. 2012 Journal of Atmospheric and Solar-Terrestrial Physics 92-97A long and continuous temperature data set from ground to mesopause was obtained in merging lidar and radiosonde data at mid-latitude over south of France (44°N). The analyses using Empirical Orthogonal Functions has been applied on vertical temperature profiles to investigate the variability differently than it has been done in previous investigations. This study reveals as the first mode in winter, a strong anti-correlation between upper stratosphere and mesosphere that is most probably link with planetary waves propagation and associated stratospheric warmings. While in summer the variability is located in the mesosphere and associated with mesospheric inversions that are probably generated by gravity waves breaking. This study shows that even if the daily temperature variability appears to be complex, a large part (30%) can be modeled, each season, using the first EOF. These vertical patterns exhibit some similarities with solar-atmospheric responses, suggesting a potential feedback of the dynamic. This is already observed for winter response, but during summer the contribution of gravity waves on the mesospheric solar response suggests future investigations to explore the role of this potential mechanism in solar-atmospheric connections. Interactions between the stratosphere, the sun and the QBO during the northern summerLabitzke and Kunze 2012 Journal of Atmospheric and Solar-Terrestrial Physics 75-76, 141-146We have shown in a number of papers that a large part of the variability of the temperatures observed especially in the tropical stratosphere is correlated with the 11-year sunspot cycle. In our analyses we stratified the data according to the phase of the QBO (Quasi-Biennial Oscillation) and we got very clear correlations between the stratified temperatures in the stratosphere and the 11-year solar cycle. Our results, mainly given as the difference between solar maxima and minima, show a large influence of the 11-year solar cycle on the temperatures and geopotential heights of the lower and middle stratosphere, and on the equatorial QBO. With the new data since 2003 we can prolong our data series by 8 years, that is by one weak solar maximum and a deep solar minimum. These new data fully confirm our earlier results. Solar and volcanic fingerprints in tree-ring chronologies over the past 2000 yearsBreitenmoser et al. 2012 Palaeogeography, Palaeoclimatology, Palaeoecology 313, 127-139The Sun is the main driver of Earth's climate, yet the Sun's role in forcing decadal-to-centennial climate variations has remained controversial, especially in the context of understanding contributions of natural climate forcings to continuing global warming. To properly address long-term fingerprints of solar forcing on climate, long-term, very high-resolution, globally distributed climate proxy records are necessary. In this study we compile and evaluate a near global collection of annually-resolved tree-ring-based climate proxies spanning the past two millennia. We statistically assess these records in both the time and frequency domains for solar forcing (i.e. Total Solar Irradiance; TSI) and climate variability with emphasis on centennial time scales. Analyses in the frequency domain indicate significant periodicities in the 208-year frequency band, corresponding to the DeVries cycle of solar activity. Additionally, results from Superposed Epoch Analysis (SEA) point toward a possible solar contribution in the temperature and precipitation series. However, solar-climate associations remain weak, with for example no clear linkage distinguishable in the southwestern United States drought records at centennial time scales. Other forcing factors, namely volcanic activity, appear to mask the solar signal in space and time. To investigate this hypothesis, we attempted to extract volcanic signals from the temperature proxies using a statistical modelling approach. Wavelet analysis of the volcanic contribution reveals significant periodicities near the DeVries frequency during the Little Ice Age (LIA). This remarkable and coincidental superposition of the signals makes it very difficult to separate volcanic and solar forcing during the LIA. Nevertheless, the "volcano free" temperature records show significant periodicities near the DeVries periodicity during the entire past 1500 years, further pointing to solar mechanisms and emphasising the need for solar related studies in the absence of strong multi-decadal volcanic forcing. Millennial-scale climate cycles in Permian-Carboniferous rhythmites: Permanent feature throughout geologic time?Franco et al. 2012 Geology 40, 19-22Two late Paleozoic glacial rhythmite successions from the Itararé Group (Paraná Basin, Brazil) were examined for paleoclimate variations. Paleomagnetic (characteristic remanent magnetization, ChRM) and magnetic susceptibility (Kz) measurements taken from the rhyth- mites are interpreted as paleoclimatic proxies. Ratios of low-frequency components in the Kz variations suggest Milankovitch periodicities; this leads to recognition of other, millennial-scale variations reminiscent of abrupt climate changes during late Quaternary time, and are suggestive of Bond cycles and the 2.4 k.y. solar cycle. We infer from these patterns that millennial-scale climate change is not restricted to the Quaternary Period, and that millennial forcing mechanisms may have been prevalent throughout geologic time. Effects of the 11 year solar cycle on middle atmospheric stationary wave patterns in temperature, ozone, and water vaporGabriel et al. 2011 Journal of Geophysical Research 116, D23301The influence of the 11 year cycle in solar irradiation on middle atmospheric stationary wave patterns in temperature, ozone, and water vapor, as indicated by the deviations from zonal mean T*, O3*, and H2O*, is investigated on the basis of time-slice simulations with the general circulation and chemistry model HAMMONIA for solar maximum and minimum conditions. For northern winter, the long-term means of the three parameters are characterized by a pronounced wave-one pattern in the middle atmosphere, but for each of the parameters with a different shift in phase with increasing height. We find a significant increase in amplitude and a horizontal shift in phase of these wave-one patterns when changing from solar minimum to maximum, i.e., regional changes of about ±2-3 K in T*, ±4%-5% in O3*, and ±2%-3% in H2O*. We demonstrate that the solar variability induces these changes by modulating the effect of zonally asymmetric radiative heating due to the stationary wave-one patterns in ozone and other absorbers and to subsequent modulations in planetary wave propagation and wave-driven transport. A comparison with ensemble means for solar maximum and minimum derived from European Centre of Medium-Range Weather Forecasts (ECMWF) Reanalysis data (ERA-40) shows reasonable agreement but also some differences in the significance and location of the solar signals, which is discussed in relation to the different setups of the two data sets. Overall, the results indicate a remarkable effect of the solar cycle on local changes in temperature, wave dynamics, and transport at northern midlatitudes and polar latitudes. Solar activity and Svalbard temperaturesSolheim et al. in press Advances in MeteorologyThe long temperature series at Svalbard (Longyearbyen) show large variations, and a positive trend since its start in 1912. During this period solar activity has increased, as indicated by shorter solar cycles. The temperature at Svalbard is negatively correlated with the length of the solar cycle. The strongest negative correlation is found with lags 10-12 years. The relations between the length of a solar cycle and the mean temperature in the following cycle, is used to model Svalbard annual mean temperature, and seasonal temperature variations. Residuals from the annual and winter models show no autocorrelations on the 5 per cent level, which indicates that no additional parameters are needed to explain the temperature variations with 95 per cent significance. These models show that 60 per cent of the annual and winter temperature variations are by solar activity. For the spring, summer and fall temperatures autocorrelations in the residuals exists, and additional variables may contribute to the variations. These models can be applied as forecasting models. We predict an annual mean temperature decrease for Svalbard of 3.5+-2oC from solar cycle 23 to solar cycle 24 (2009-20) and a decrease in the winter temperature of c. 6 oC. Probing the climatological impact of a cosmic ray-cloud connection through low-frequency radio observationsMagee and Kavic 2012 Journal of Atmospheric and Solar-Terrestrial Physics 74, 224-231It has been proposed that cosmic ray events could have a causal relationship with cloud formation rates. Given the weak constraints on the role that cloud formation plays in climate forcing it is essential to understand the role such a relationship could have in shaping the Earth's climate. This issue has been previously investigated in the context of the long-term effect of cosmic ray events on climate. However, in order to establish whether or not such a relationship exists, measurements of short-timescale solar events, individual cosmic ray events, and spatially correlated cloud parameters could be of great significance. Here we propose such a comparison using observations from a pair of radio telescopes arrays, the Long Wavelength Array (LWA) and the Eight-meter-wavelength Transient Array (ETA). These low-frequency radio arrays have a unique ability to simultaneously conduct solar, ionospheric and cosmic rays observations and are thus ideal for such a comparison. We will outline plans for a comparison using data from these instruments, satellite images of cloud formation as well as expected cloud formation rates from numerical models. We present some preliminary results illustrating the efficacy of this type of comparison and discuss future plans to carryout this program. On the relationship between global, hemispheric and latitudinal averaged air surface temperature (GISS time series) and solar activityEcher et al. 2012 Journal of Atmospheric and Solar-Terrestrial Physics 74, 87-93The air surface temperature is a basic meteorological parameter and its variation is a primary measure of global, regional and local climate changes. In this work, the global, hemispheric and latitudinal averaged air surface temperature time series, obtained from the NASA/Goddard Institute for Space Studies (GISS), and the Sunspot Number (Rz) for the interval 1880-2005, are decomposed in frequency bands through wavelet multi-resolution analysis. We have found a very low correlation between global, hemispheric and latitudinal averaged air surface temperature and Rz in the 11 yr solar cycle band (8-16 years) from 1880 to 1950. Afterwards the correlation is higher. A very significant correlation (R 0.57 to 0.80) is found in the 22 yr solar Hale cycle band (16-32 years) with lags from zero to four years between latitudinal averages air surface temperature and Rz. Therefore it seems that the 22 yr magnetic field solar cycle might have a higher effect on Earth's climate than solar variations related to the 11 yr sunspot cycle. Evidence of Suess solar-cycle bursts in subtropical Holocene speleothem d18O recordsKnudsen et al. in press The HoloceneSeveral studies indicate that changes in solar activity may have driven Holocene subtropical monsoon variability on decadal and centennial timescales, but the strength and nature of this link remains debated. In this study, we combine a recent mapping of the Holocene solar-cycle activity with four subtropical speleothem d18O records, which allows a strong test of the link between solar activity, monsoon activity (or intensity), and the hydrological cycle. This is possible because the speleothem d18O records mainly reflect changes in local rainfall composition, which is controlled by changes in total moisture loss along the atmospheric transport path and monsoon intensity. We find that the spectral density distributions of the speleothem records exhibit particularly significant c. 210 yr cyclicities that tend to coincide in time with the three Suess solar-cycle bursts, i.e. intervals around 1850-3200 BP, 4500-5700 BP, and 7750-8850 BP when the c. 210 yr solar cycle was particularly strong. The speleothems from Dongge Cave (China) and Sofular Cave (Turkey) appear to have recorded all three Suess bursts, whereas the speleothems from Heshang Cave (China) and Pink Panther Cave (southwestern USA) only recorded the first and last Suess bursts, and the middle Suess burst, respectively. The temporal relationship between the Suess solar cycle and particularly significant 210 yr oscillations in the speleothem d18O records therefore supports the notion that solar variability played a significant role in driving centennial-scale changes in the hydrological cycle in the subtropics during the Holocene. Vísindagreinar frá árinu 2011Analyzing Solar CyclesSolanki and Krivova 2011 Science 334, 916-917Since observational records began about 300 years ago, and very likely for millions of years before that, the Sun has displayed cyclically varying magnetic activity (1). Approximately every 11 years, a maximum of activity is reached, with a large number of sunspots (see the figure, panel A) present on the solar surface, strong x-ray emission from the corona, and a peak in the number of flares and coronal mass ejections. The latter cause mid- and low-latitude aurorae, disrupt radio communications, perturb navigation systems and radars, produce electric power outages, and can pose radiation hazards for astronauts and aircraft crew. Taking the pulse of the Sun during the Holocene by joint analysis of 14C and 10BeKnudsen et al. 2009 Geophysical Research Letters 36, L16701We have studied solar variations during the Holocene (i.e., last c.11,700 yr) by combining a new model of the Earth's dipole moment with 14C data from the IntCal04 record and 10Be data from the GRIP ice core. Joint spectral analysis of the two nuclide records suggests that the periodic behavior of the Sun was particularly pronounced between 6000-4500 yr BP and 3000-2000 yr BP, with dominating periodicities of c.88, c.150, c.220, and c.400 years, while this rhythmic behavior faded during other time intervals. The fact that the two reconstructions, based on radionuclides with distinct geochemical properties, agree with respect to both the frequency and timing of the periodic behavior, strongly suggests that they reflect the actual behavior of the Sun. Subtle but systematic differences between the amplitude spectra may point to an interplay between the climate system and the c.220- and c.400-year solar cycles during intervals when these were particularly prominent. Does the space environment affect the ecosphere?Schwadron et al. 2011 Eos Transactions AGU, 92The Sun is now emerging from a deep and protracted solar minimum, when the power, pressure, flux, and magnetic flux of solar wind were at their lowest levels [McComas et al., 2008; Schwadron and McComas, 2008; Connick et al., 2011]. Because of an anomalously weak heliospheric magnetic field and low solar wind pressure, galactic cosmic rays (GCRs)-protons, electrons, and ionized nuclei of elements accelerated to high energies-achieved the highest fluxes observed in the space age (Figure 1) [Mewaldt et al., 2010]. Related observations have shown remarkably rapid changes in the fluxes of energetic neutral atoms (ENAs) used by NASA's Interstellar Boundary Explorer mission to image the global heliosphere surrounding the solar system [McComas et al., 2010]. These changes in ENAs are caused by decreasing solar wind pressure. Does the recent anomalous deep solar minimum hint at larger changes in store? And how do changing GCR fluxes and conditions on the Sun influence Earth's ecosphere? Given the fact that GCR radiation can damage living tissue, causing cellular mutagenesis, the changing state of the Sun may have serious implications for life on the planet. Abrupt variations in South American monsoon rainfall during the Holocene based on a speleothem record from central-eastern BrazilStrikis et al. 2011 Geology 39: 1075-1078Well-dated high-resolution oxygen isotope records of speleothems in central-eastern Brazil spanning from 1.3 to 10.2 kyr B.P. reveal that the occurrence of abrupt variations in monsoon precipitation is not random. They show a striking match with Bond events and a significant pacing at c.800 yr, a dominant periodicity present in sea surface temperature records from both the North Atlantic and equatorial Pacific Oceans that is possibly related to periods of low solar activity (high 14C based on the atmospheric d14C record). The precipitation variations over central-eastern Brazil are broadly anti-phased with the Asian and Indian Monsoons during Bond events and show marked differences in duration and structure between the early and late Holocene. Our results suggest that these abrupt multicentennial precipitation events are primarily linked to changes in the North Atlantic meridional overturning circulation (AMOC). Anomalous cross-equatorial flow induced by negative AMOC phases may have modulated not only the monsoon in South America but also affected El Nino-like conditions in the tropical Pacific during the Holocene. Identifying natural contributions to late Holocene climate changeHumlum et al. 2011 Global and Planetary Change 79, 145-156Analytic climate models have provided the means to predict potential impacts on future climate by anthropogenic changes in atmospheric composition. However, future climate development will not only be influenced by anthropogenic changes, but also by natural variations. The knowledge on such natural variations and their detailed character, however, still remains incomplete. Here we present a new technique to identify the character of natural climate variations, and from this, to produce testable forecast of future climate. By means of Fourier and wavelet analyses climate series are decomposed into time-frequency space, to extract information on periodic signals embedded in the data series and their amplitude and variation over time. We chose to exemplify the potential of this technique by analysing two climate series, the Svalbard (78°N) surface air temperature series 1912-2010, and the last 4000 years of the reconstructed GISP2 surface temperature series from central Greenland. By this we are able to identify several cyclic climate variations which appear persistent on the time scales investigated. Finally, we demonstrate how such persistent natural variations can be used for hindcasting and forecasting climate. Our main focus is on identifying the character (timing, period, amplitude) of such recurrent natural climate variations, but we also comment on the likely physical explanations for some of the identified cyclic climate variations. The causes of millennial climate changes remain poorly understood, and this issue remains important for understanding causes for natural climate variability over decadal- and decennial time scales. We argue that Fourier and wavelet approaches like ours may contribute towards improved understanding of the role of such recurrent natural climate variations in the future climate development. Short term climate variability during "Roman Classical Period" in the eastern MediterraneanChen et al. in press Quaternary Science ReviewsTo obtain insight into character and potential forcing of short-term climatic and oceanographic variability in the southern Italian region during the "Roman Classical Period" (60 BC-AD 200), climatic and environmental reconstructions based on a dinoflagelate cyst record from a well dated site in the Gulf of Taranto located at the distal end of the Po-river discharge plume have been established with high temporal resolution. Short-term fluctuations in accumulation rates of the Adriatic Surface Water species Lingulodinium machaerophorum, the freshwater algae Concentricystes and species resistant to aerobic degradation indicate that fluctuations in the trophic state of the upper waters are related to river discharge of northern and eastern Italian rivers which in turn are strongly related to precipitation in Italy. The dinoflagellate cyst association indicates that local sea surface temperatures which in this region are strongly linked to local air temperatures were slightly higher than today. We reconstruct that sea surface temperatures have been relatively high and stable between 60 BC-AD 90 and show a decreasing trend after AD 90. Fluctuations in temperature and river discharge rates have a strong cyclic character with main cyclicities of 7-8 and 11 years. We argue that these cycles are related to variations of the North Atlantic Oscillation climate mode. A strong correlation is observed with global variation in d14C anomalies suggesting that solar variability might be one of the major forcings of the regional climate. Apart from cyclic climate variability we observed a good correlation between non-cyclic temperature drops and global volcanic activity indicating that the latter forms an additional major forcing factor of the southern Italian climate during the Roman Classical Period. The combined effects of ENSO and the 11-year solar cycle on the Northern Hemisphere polar stratosphereCalvo and Marsh 2011 Journal of Geophysical ResearchThe combined effects of El Ninho-Southern Oscillation (ENSO) and the 11-year solar cycle on the Northern Hemisphere (NH) polar stratosphere have been analyzed in the Whole Atmosphere Community Climate Model version 3 in the absence of the Quasi-Biennial Oscillation. The polar response to ENSO agrees with previous studies during solar minimum; composites of warm minus cold ENSO events show a warmer polar stratosphere and a weaker polar vortex, propagating downwards as the winter evolves. During solar maximum conditions, little downward propagation of the ENSO signal is simulated, leading to colder temperatures and stronger winds in the polar lower stratosphere. The analysis of the Eliassen-Palm flux and wave index of refraction shows that this is mainly due to a reduction of upward propagating extratropical planetary wavenumber 1 component caused by changes in the background winds in the subtropics related to a warmer tropical upper stratosphere during solar maximum. The effect of the 11-year solar cycle variability on the polar stratosphere is not significant during cold ENSO events until February. During warm ENSO events, a statistically significant colder polar lower stratosphere and stronger polar vortex is simulated throughout the winter and no downward propagation of this signal occurs. This is mainly due to the combined effects of solar maximum and warm ENSO conditions on the wave-mean flow interaction. These results show a nonlinear behavior of the extratropical stratosphere response to the combination of the two forcings; and highlight the need to stratify with respect to ENSO and solar conditions and analyze the seasonal march throughout the winter. High-resolution solar spectral irradiance from extreme ultraviolet to far infraredFontenla et al. 2011 Journal of Geophysical Research 116, D20108This paper presents new extremely high-resolution solar spectral irradiance (SSI) calculations covering wavelengths from 0.12 nm to 100 micron obtained by the Solar Irradiance Physical Modeling (SRPM) system. Daily solar irradiance spectra were constructed for most of Solar Cycle 23 based on a set of physical models of the solar features and non-LTE calculations of their emitted spectra as function of viewing angle, and solar images specifying the distribution of features on the solar disk. Various observational tests are used to assess the quality of the spectra provided here. The present work emphasizes the effects on the SSI of the upper chromosphere and full-non-LTE radiative transfer calculation of level populations and ionizations that are essential for physically consistent results at UV wavelengths and for deep lines in the visible and IR. This paper also considers the photodissociation continuum opacity of molecular species, e.g., CH and OH, and proposes the consideration of NH photodissociation which can solve the puzzle of the missing near-UV opacity in the spectral range of the near-UV. Finally, this paper is based on physical models of the solar atmosphere and extends the previous lower-layer models into the upper-transition-region and coronal layers that are the dominant source of photons at wavelengths shorter than c.50 nm (except for the He II 30.4 nm line, mainly formed in the lower-transition-region). Solar motion and discharge of Parana River, South America: Evidence for a linkAntico and Kröhling 2011 GEOPHYSICAL RESEARCH LETTERS 38, L19401A link between climate and the motion of the Sun around the barycenter of the solar system has been suggested, mostly on the basis of interannual cycles observed in climatological data from the Northern Hemisphere. This study provides empirical evidence for a connection between this solar motion and discharge of the Paraná River, which has the second largest drainage basin of South America. Solar motion is described here by the absolute value of the time derivative of solar angular momentum (t). For the time period 1904-2008, the time evolution of both t and river discharge is dominated by cycles with periods between 7 and 9 yr. Within this frequency band, a statistically significant anticorrelation is found between t and river discharge with minima of t coinciding with increased river discharge. Variation in surface air temperature of China during the 20th centurySoon et al. 2011 Journal of Atmospheric and Solar-Terrestrial Physics 73, 2331-2344The 20th century surface air temperature (SAT) records of China from various sources are analyzed using data which include the recently released Twentieth Century Reanalysis Project dataset. Two key features of the Chinese records are confirmed: (1) significant 1920s and 1940s warming in the temperature records, and (2) evidence for a persistent multidecadal modulation of the Chinese surface temperature records in co-variations with both incoming solar radiation at the top of the atmosphere as well as the modulated solar radiation reaching ground surface. New evidence is presented for this Sun-climate link for the instrumental record from 1880 to 2002. Additionally, two non-local physical aspects of solar radiation-induced modulation of the Chinese SAT record are documented and discussed. Teleconnections that provide a persistent and systematic modulation of the temperature response of the Tibetan Plateau and/or the tropospheric air column above the Eurasian continent (e.g., 30°N-70°N; 0°-120°E) are described. These teleconnections may originate from the solar irradiance-Arctic-North Atlantic overturning circulation mechanism proposed by Soon (2009). Also considered is the modulation of large-scale land-sea thermal contrasts both in terms of meridional and zonal gradients between the subtropical western Pacific and mid-latitude North Pacific and the continental landmass of China. The Circum-global teleconnection (CGT) pattern of summer circulation of Ding and Wang (2005) provides a physical framework for study of the Sun-climate connection over East Asia. Our results highlight the importance of solar radiation reaching the ground and the concomitant importance of changes in atmospheric transparency or cloudiness or both in motivating a true physical explanation of any Sun-climate connection. We conclude that ground surface solar radiation is an important modulating factor for Chinese SAT changes on multidecadal to centennial timescales. Therefore, a comprehensive view of local and remote factors of climate change in China must take account of this as well as other natural and anthropogenic forcings. The contribution of cosmic rays to global warmingSloan and Wolfendale 2011 Journal of Atmospheric and Solar-Terrestrial Physics 73, 2352-2355A search has been made for a contribution of the changing cosmic ray intensity to the global warming observed in the last century. The cosmic ray intensity shows a strong 11 year cycle due to solar modulation and the overall rate has decreased since 1900. These changes in cosmic ray intensity are compared to those of the mean global surface temperature to attempt to quantify any link between the two. It is shown that, if such a link exists, the changing cosmic ray intensity contributes less than 8% to the increase in the mean global surface temperature observed since 1900. Variability of sunspot cycle QBO and total ozone over high altitude western Himalayan regionsNingombam 2011 Journal of Atmospheric and Solar-Terrestrial Physics 73, 2305-2313Long-term trend of total column ozone at high altitude region in Ladakh is studied, using a total ozone mapping spectrometer and an ozone monitoring instrument during 1979-2008. In the region, total ozone exhibits seasonality with maximum in spring and minimum in autumn. The decreasing trend of total ozone was found as -2.51+-0.45% per decade with 95% confidence level in the region. Ozone deficiency in the Ladakh region is strongest (-33.9 DU at Hanle) in May and weakest (-11.5 DU at Hanle) in January-February. In the study, the solar maximum in 1990 is in phase with ozone maximum, while ozone variation lags in phase with the 1980 and 2000 solar maxima. However, a significant correlation between total ozone and sunspot number is achieved in the westerly phase of quasi-biennial oscillation during spring season. Decreasing trend of ozone in the region is correlating well with the cooling rate in the lower stratosphere. Climate patterns in north central China during the last 1800 yr and their possible driving forceTan et al. 2011 Climate of the Past 7, 685-692We synthesized high-resolution precisely-dated stalagmite records and historical document records from north central China to reconstruct a decadal resolution precipitation record during the last 1800 years (190-1980 AD). The synthesized precipitation record shows coincident variations and significant positive correlations with the temperature reconstructions on centennial- to multidecadal-scale, suggesting warm-humid/cool-dry was the main climate pattern in north central China over the past 1800 years. Solar activity may be the dominant force that drove the same-phase variations of the temperature and precipitation in north central China. Atmospheric science: Solar cycle and climate predictionsMatthes, 2011 Nature Geoscience, in press[review of Ineson et al. in the same issue] The impact of solar activity on climate has been debated heatedly. Simulations with a climate model using new observations of solar variability suggest a substantial influence of the Sun on the winter climate in the Northern Hemisphere. Solar forcing of winter climate variability in the Northern HemisphereIneson et al. 2011 Nature Geoscience, in pressAn influence of solar irradiance variations on Earth's surface climate has been repeatedly suggested, based on correlations between solar variability and meteorological variables. Specifically, weaker westerly winds have been observed in winters with a less active sun, for example at the minimum phase of the 11-year sunspot cycle. With some possible exceptions, it has proved difficult for climate models to consistently reproduce this signal. Spectral Irradiance Monitor satellite measurements indicate that variations in solar ultraviolet irradiance may be larger than previously thought. Here we drive an ocean-atmosphere climate model with ultraviolet irradiance variations based on these observations. We find that the model responds to the solar minimum with patterns in surface pressure and temperature that resemble the negative phase of the North Atlantic or Arctic Oscillation, of similar magnitude to observations. In our model, the anomalies descend through the depth of the extratropical winter atmosphere. If the updated measurements of solar ultraviolet irradiance are correct, low solar activity, as observed during recent years, drives cold winters in northern Europe and the United States, and mild winters over southern Europe and Canada, with little direct change in globally averaged temperature. Given the quasiregularity of the 11-year solar cycle, our findings may help improve decadal climate predictions for highly populated extratropical regions. A record of the Southern Oscillation Index for the past 2,000 years from precipitation proxiesYan et al. 2011 Nature Geoscience 4, 611-614The El Nino-Southern Oscillation (ENSO) is a coupled ocean-atmosphere climate phenomenon in the tropical Pacific Ocean. The interannual climate variations have been shown to modify both the Hadley and Walker meridional and zonal atmospheric circulations, with strong impacts on global climate. Proxy-based reconstructions of the Southern Oscillation Index on a multi-decadal scale have shown that the strength and frequency of El Nino occurrences have varied over the past millennium. Here we compile reconstructions of precipitation from regions that experience substantial ENSO variability to extend the multidecadal-scale Southern Oscillation Index to include the past 2,000 years. We find that the Medieval Warm Period (c. AD 800-1300) was characterized by a negative index, which indicates more El Nino-dominated conditions, whereas during the Little Ice Age (c. AD 1400-1850) more La Nina-dominated conditions prevailed. The Southern Oscillation Index we derive is significantly correlated with reconstructions of solar irradiance and mean Northern Hemisphere temperature fluctuations. Alpine climate during the Holocene: a comparison between records of glaciers, lake sediments and solar activityNussbaumer et al. 2011 Journal of Quaternary Science 7, 703-713The European Alps are very sensitive and vulnerable to climate change. Recent improvements in Alpine glacier length records and climate reconstructions from annually laminated sediments of Alpine Lake Silvaplana give the opportunity to investigate the relationship between these two data sets of Alpine climate. Two different time frames are considered: the last 500-1000 years as well as the last 7400 years. First, we found good agreement between the two different climate archives during the past millennium: mass accumulation rates and biogenic silica concentration are largely in phase with the glacier length changes of Mer de Glace and Unterer Grindelwaldgletscher, and with the records of glacier length of Grosser Aletschgletscher and Gornergletscher. Secondly, the records are compared with temporally highly resolved data of solar activity. The Sun has had a major impact on the Alpine climate variations in the long term, i.e. several centuries to millennia. Solar activity varies with the Hallstatt periodicity of about 2000 years. Hallstatt minima are identified around 500, 2500 and 5000 a. Around these times grand solar minima (such as the Maunder Minimum) occurred in clusters coinciding with colder Alpine climate expressed by glacier advances. During the Hallstatt maxima around 0, 2000 and 4500 a, the Alpine glaciers generally retreated, indicating a warmer climate. This is supported by archaeological findings at Schnidejoch, a transalpine pass in Switzerland that was only accessible when glaciers had retreated. On shorter timescales, however, the influence of the Sun cannot be as easily detected in Alpine climate change, indicating that in addition to solar forcing, volcanic influence and internal climate variations have played an important role. Sunspot Modeling: From Simplified Models to Radiative MHD SimulationsRempel and Schlichenmaier 2011 Living Reviews in Solar Physics 8, 3We review our current understanding of sunspots from the scales of their fine structure to their large scale (global) structure including the processes of their formation and decay. Recently, sunspot models have undergone a dramatic change. In the past, several aspects of sunspot structure have been addressed by static MHD models with parametrized energy transport. Models of sunspot fine structure have been relying heavily on strong assumptions about flow and field geometry (e.g., flux-tubes, "gaps", convective rolls), which were motivated in part by the observed filamentary structure of penumbrae or the necessity of explaining the substantial energy transport required to maintain the penumbral brightness. However, none of these models could self-consistently explain all aspects of penumbral structure (energy transport, filamentation, Evershed flow). In recent years, 3D radiative MHD simulations have been advanced dramatically to the point at which models of complete sunspots with sufficient resolution to capture sunspot fine structure are feasible. Here, overturning convection is the central element responsible for energy transport, filamentation leading to fine structure, and the driving of strong outflows. On the larger scale these models are also in the progress of addressing the subsurface structure of sunspots as well as sunspot formation. With this shift in modeling capabilities and the recent advances in high resolution observations, the future research will be guided by comparing observation and theory. Nonlinear and nonstationary influences of geomagnetic activity on the winter North Atlantic OscillationLi et al. 2011 JOURNAL OF GEOPHYSICAL RESEARCH 116, D16109The relationship between the geomagnetic aa index and the winter North Atlantic Oscillation (NAO) has previously been found to be nonstationary, being weakly negative during the early 20th century and significantly positive since the 1970s. The study reported here applies a statistical method called the generalized additive modeling (GAM) to elucidate the underlying physical reasons. We find that the relationship between aa index and the NAO during the Northern Hemispheric winter is generally nonlinear and can be described by a concave shape with a negative relation for small to medium aa and a positive relation for medium to large aa. The nonstationary character of the aa-NAO relationship may be ascribed to two factors. First, it is modulated by the multidecadal variation of solar activity. This solar modulation is indicated by significant change points of the trends of solar indices around the beginning of solar cycle 14, 20, and 22 (i.e., -1902/1903, -1962/1963, and -1995/1996). Coherent changes of the trend in the winter time NAO followed the solar trend changes a few years later. Second, the aa-NAO relationship is dominated by the aa data from the declining phase of even-numbered solar cycles, implying that the 27 day recurrent solar wind streams may be responsible for the observed aa-NAO relationship. It is possible that an increase of long-duration recurrent solar wind streams from high-latitude coronal holes during solar cycles 20 and 22 may partially account for the significant positive aa-NAO relationship during the last 30 years of the 20th century. Was UV spectral solar irradiance lower during the recent low sunspot minimum?Lockwood 2011 JOURNAL OF GEOPHYSICAL RESEARCH 116, D16103A detailed analysis is presented of solar UV spectral irradiance for the period between May 2003 and August 2005, when data are available from both the Solar Ultraviolet Spectral Irradiance Monitor (SUSIM) instrument (on board the Upper Atmosphere Research Satellite (UARS) spacecraft) and the Solar Stellar Irradiance Comparison Experiment (SOLSTICE) instrument (on board the Solar Radiation and Climate Experiment (SORCE) satellite). The ultimate aim is to develop a data composite that can be used to accurately determine any differences between the "exceptional" solar minimum at the end of solar cycle 23 and the previous minimum at the end of solar cycle 22 without having to rely on proxy data to set the long-term change. SUSIM data are studied because they are the only data available in the "SOLSTICE gap" between the end of available UARS SOLSTICE data and the start of the SORCE data. At any one wavelength the two data sets are considered too dissimilar to be combined into a meaningful composite if any one of three correlations does not exceed a threshold of 0.8. This criterion removes all wavelengths except those in a small range between 156 nm and 208 nm, the longer wavelengths of which influence ozone production and heating in the lower stratosphere. Eight different methods are employed to intercalibrate the two data sequences. All methods give smaller changes between the minima than are seen when the data are not adjusted; however, correcting the SUSIM data to allow for an exponentially decaying offset drift gives a composite that is largely consistent with the unadjusted data from the SOLSTICE instruments on both UARS and SORCE and in which the recent minimum is consistently lower in the wave band studied. Empirical Mode Decomposition applied to solar irradiance, global temperature, sunspot number, and CO2 concentration dataBarnhart and Eichinger 2011 Journal of Atmospheric and Solar-Terrestrial Physics 73, 1771-1779Empirical Mode Decomposition (EMD) is a tool that can decompose and analyze the cyclic components from oscillatory data in the time-domain. When combined with the traditional Hilbert spectral analysis, it is similar to spectral tools such as Fourier analysis, wavelet analysis, and generalized time-frequency analysis. However, the EMD method is specifically designed to analyze nonstationary data from nonlinear processes. Fluctuations of total solar irradiance, global temperature, sunspot number, and CO2 concentration are decomposed into their periodic components using the EMD method. The cyclic components of the data are analyzed and compared in the time-domain. An 11-year oscillation in global mean temperature is found and compared with the Schwabe cycle from sunspot and total solar irradiance proxy data. Also, the relative radiative forcing from different periodic components of total solar irradiance and CO2 concentration are empirically estimated. Cosmic ray effects on cloud cover and their relevance to climate changeErlykin and Wolfendale 2011 Journal of Atmospheric and Solar-Terrestrial Physics 73, 1681-1686A survey is made of the evidence for and against the hypothesis that cosmic rays influence cloud cover. The analysis is made principally for the troposphere. It is concluded that for the troposphere there is only a very small overall value for the fraction of cloud attributable to cosmic rays (CR); if there is linearity between CR change and cloud change, the value is probably 1% for clouds below 6.5km, but less overall. The apparently higher value for low cloud is an artifact. The contribution of CR to 'climate change' is quite negligible. Solar-geomagnetic activity influence on Earth's climateMufit and Shah 2011 Journal of Atmospheric and Solar-Terrestrial Physics 73, 1607-1615A long uninterrupted homogeneous data set on the annual mean Sea Surface Temperature (SST) anomaly records as a representative of the Earth's climatic parameter has been analyzed in conjunction with 158 year long time series on the annual sunspot indices, Rz and geomagnetic activity indices, aa for the period 1850-2007. The 11-year and 23-year overlapping means of global (dtg) as well as northern (dtn) and southern (dts) hemispheric SST anomalies reveal significant positive correlation with both Rz and aa indices. Rz, aa and dtg depict a similar trend in their long-term variation and both seem to be on increase after attaining a minimum in the early 20th century (not, vert, similar1905). Whereas the results on the power spectrum analysis by the Multi-Taper Method (MTM) on dtg, Rz and aa reveal periodicities of not, vert, similar79-80 years (Gleissberg's cycle) and not, vert, similar9-11 years (Schwabe solar cycle) consistent with earlier findings, MTM spectrum analysis also reveals fast cycles of 3-5 years. A period of not, vert, similar4.2 years in aa at 99% confidence level appears recorded in dtg at not, vert, similar4.3 years at 90% confidence level. A period of not, vert, similar3.6-3.7 years at 99% confidence level found in dtg is correlating with a similar periodic variation in sector structure of Interplanetary Magnetic Field (IMF). This fast cycle parallelism is new and is supportive of a possible link between the solar-modulated geomagnetic activity and Earth's climatic parameter i.e. SST. Evidence of solar signals in tree rings of Smith fir from Sygera Mountain in southeast TibetWang and Zhang 2011 Journal of Atmospheric and Solar-Terrestrial Physics 73, 1959-1966Solar activity is one of the most important driving forces of the global climate and environment change. However, little is known about how this force is influencing the earth's climate system due to short solar activity records. A tree-ring chronology of Abies georgei var. smithii at Sygera Mountain in southeast Tibet was developed and used to investigate solar activity signals by spectral, wavelet and cross-wavelet analyses. The results showed that fluctuations in tree-ring data coincided well with variations in sunspot numbers. Periodicities of 5.3-5.1, 11.2-11.1, 20.5, 73, and 204.1 years may be related to solar activity of the second harmonic of the Schwabe, Schwabe, Hale, Gleissberg, and Suess cycles. The cross-wavelet analysis between tree-ring data and sunspot numbers indicated that the cross power around the 11-year solar cycle is more significant during periods of high solar activity than low solar activity, and the significant 22-year solar cycle is also found. Cross-correlation analysis between these two series showed a significant relationship with a time lag of about 13 years and a non-stationary phase relationship. We therefore propose that solar activity modulated climatic conditions and tree growth by influencing surface temperature through variations in radiation energy and monsoonal precipitation on the Tibetan Plateau. Temporal derivative of Total Solar Irradiance and anomalous Indian summer monsoon: An empirical evidence for a Sun-climate connectionAgnihotri et al. 2011 Journal of Atmospheric and Solar-Terrestrial Physics 73, 1980-1987Identifying the pattern of natural climate variability is of immense importance to delineate the effects of anthropogenic climate changes. Global and regional climates are suspected to vary, in unison or with delays, with the Total Solar Irradiance (TSI) at decadal to centennial timescales. Here we show that the Indian summer monsoon rainfall correlates well with the temporal derivative of TSI on multi-decadal timescales. This linkage between the temporal derivative of TSI and the Indian summer monsoon is tested and corroborated both for the instrumental period (1871-2006) and for the last 300 years using a speleothem d18O record representing rainfall in southwestern India. Our analyses indicate that anomalous dry periods of the Indian monsoon are mostly coincident with negative TSI derivative. This study thus demonstrates the potential of ''TSI derivative' as an important indicator of natural monsoon variability on an interdecadal timescale. Solar activity-climate relations: A different approachStauning, 2011 Journal of Atmospheric and Solar-Terrestrial Physics 73, 1999-2012The presentation of solar activity-climate relations is extended with the most recent sunspot and global temperature data series. The extension of data series shows clearly that the changes in terrestrial temperatures are related to sources different from solar activity after not, vert, similar1985. Based on analyses of data series for the years 1850-1985 it is demonstrated that, apart from an interval of positive deviation followed by a similar negative excursion in Earth's temperatures between not, vert, similar1923 and 1965, there is a strong correlation between solar activity and terrestrial temperatures delayed by 3 years, which complies with basic causality principles. A regression analysis between solar activity represented by the cycle-average sunspot number, SSNA, and global temperature anomalies, dTA, averaged over the same interval lengths, but delayed by 3 years, provides the relation dTA c. 0.009 (±0.002) SSNA. Since the largest ever observed SSNA is not, vert, similar90 (in 1954-1965), the solar activity-related changes in global temperatures could amount to no more than ±0.4 °C over the past not, vert, similar400 years where the sunspots have been recorded. It is demonstrated that the small amplitudes of cyclic variations in the average global temperatures over the not, vert, similar11 year solar cycle excludes many of the various driver processes suggested in published and frequently quoted solar activity-climate relations. It is suggested that the in-cycle variations and also the longer term variations in global temperatures over the examined 135 years are mainly caused by corresponding changes in the total solar irradiance level representing the energy output from the core, but further modulated by varying energy transmission properties in the active outer regions of the Sun. Statistical issues about solar-climate relationsYiou et al. 2010 Climate of the Past 6, 565-573The relationship between solar activity and temperature variation is a frequently discussed issue in climatology. This relationships is usually hypothesized on the basis of statistical analyses of temperature time series and time series related to solar activity. Recent studies (Le Mouel et al., 2008, 2009; Courtillot et al., 2010) focus on the variabilities of temperature and solar activity records to identify their relationships. We discuss the meaning of such analyses and propose a general framework to test the statistical significance for these variability-based analyses. This approach is illustrated using European temperature data sets and geomagnetic field variations. We show that tests for significant correlation between observed temperature variability and geomagnetic field variability is hindered by a low number of degrees of freedom introduced by excessively smoothing the variability-based statistics. A unified approach to orbital, solar, and lunar forcing based on the Earth's latitudinal insolation/temperature gradientDavis and Brewer 2011 Quaternary Science Reviews 30, 1861-1874Widespread empirical evidence suggests that extraterrestrial forcing influences the Earth's climate, but how this could occur remains unclear. Here we describe a new approach to this problem that unifies orbital, solar and lunar forcing based on their common control of the Earth's latitudinal insolation gradient (LIG). The LIG influences the climate system through differential solar heating between the tropics and the poles that gives rise to the latitudinal temperature gradient (LTG), which drives the Earth's atmospheric and (wind driven) ocean circulation. We use spectral analysis of recent changes in the Earth's LTG to support earlier work on orbital timescales (Davis and Brewer, 2009) that suggests the climate system may be unusually sensitive to changes in the LIG. Identification of LIG forcing of the LTG is possible because the LIG varies according to seasonally specific periodicities based on obliquity in summer (41 kyr orbital and 18.6 yr lunar cycle), and precession (21 kyr orbital cycle) and total solar irradiance (11 yr solar cycle) in winter. We analyse changes in the Northern Hemisphere LTG over the last 120 years and find significant (99%) peaks in spectral frequencies corresponding to 11 years in winter and 18.6 years in summer, consistent with LIG forcing. The cross-seasonal and multi-frequency nature of the LIG signal, and the diffuse effect of the LTG driver on the climate system may account for the complexity of the response to extraterrestrial forcing as seen throughout the climatic record. This hypersensitivity of the LTG to the LIG appears poorly reproduced in climate models, but would be consistent with the controversial theory that the LTG is finely balanced to maximise entropy. Sun-earth relationship inferred by tree growth rings in conifers from Severiano De Almeida, Southern BrazilPrestes et al. 2011 Journal of Atmospheric and Solar-Terrestrial Physics 73, 1587-1593This study of Sun-Earth relationships is based on tree growth rings analysis of araucarias (Araucaria angustifolia) collected at Severiano de Almeida (RS) Brazil. A chronology of 359 years was obtained, and the classical method of spectral analysis by iterative regression and wavelet method was applied to find periodicities and trends contained in the tree growth. The analysis of the dendrochronological series indicates representative periods of solar activity of 11 (Schwabe cycle), 22 (Hale cycle), and 80 (Gleissberg cycle) years. The result shows the possible influence of the solar activity on tree growth in the last 350 years. Periods of 2-7 years were also found and could represent a response of the trees to local climatic conditions. Good agreement between the time series of tree growth rings and the 11 year solar cycle was found during the maximum solar activity periods. Role of wave-mean flow interaction in sun-climate connections: Historical overview and some new interpretations and resultsNathan et al. 2011 Journal of Atmospheric and Solar-Terrestrial Physics 73, 1594-1605Quasi-decadal variations in solar irradiance - termed the 11-year solar cycle (SC) - have been linked to variations in a variety of atmospheric circulation features, including the polar vortex, the Brewer-Dobson circulation, and the quasi-biennial oscillation. These features share an underlying commonality: they are all rooted in wave-mean flow interaction. The purpose of this paper is to provide a historical overview of the connection between the SC and wave-mean flow interaction and to propose a more complete theoretical framework for solar modulated wave-mean flow interaction that includes both zonal-mean and zonally asymmetric ozone as intermediaries for communicating variations in solar spectral irradiance to the climate system. We solve a quasi-geostrophic model using the WKB formalism to highlight the physics connecting the SC to planetary wave-drag. Numerical results show the importance of the zonally asymmetric ozone field in mediating the effects of solar variability to the wave-driven circulation in the middle atmosphere. Middle atmosphere temperature trend and solar cycle revealed by long-term Rayleigh lidar observationsLi et al. 2011 Journal of Geophysical Research 116, D00P05The long-term temperature profile data sets obtained by Rayleigh lidars at three different northern latitudes within the Network for the Detection of Atmospheric Composition Change were used to derive the middle atmosphere temperature trend and response to the 11 year solar cycle. The lidars were located at the Mauna Loa Observatory, Hawaii (MLO, 19.5°N); the Table Mountain Facility, California (TMF, 34.4°N); and the Observatoire de Haute Provence, France (OHP, 43.9°N). A stratospheric cooling trend of 2-3 K/decade was found for both TMF and OHP, and a trend of <0.5 ± 0.5 K/decade was found at MLO. In the mesosphere, the trend at TMF (3-4 K/decade) was much larger than that at both OHP and MLO (<1 K/decade). The lidar trends agree well with earlier satellite and rocketsonde trends in the stratosphere, but a substantial discrepancy was found in the mesosphere. The cooling trend in the upper stratosphere at OHP during 1981-1994 (-2-3 K/decade) was much larger than that during 1995-2009 (<0.8 K/decade), coincident with the slightly increasing upper stratospheric ozone density after 1995. Significant temperature response to the 11 year solar cycle was found. The correlation was positive in both the stratosphere and mesosphere at MLO and TMF. At OHP a wintertime negative response in the upper stratosphere and a positive response in the middle mesosphere were observed during 1981-1994, but the opposite behavior was found during 1995-2009. This behavior may not be a direct solar cycle response at all but is likely related to an apparent response to decadal variability (e.g., volcanoes, modulated random occurrence of sudden stratospheric warmings) that is more complex. Cyclic variation and solar forcing of Holocene climate in the Alaskan subarcticHu et al. 2003 Science 301, 1890-1893High-resolution analyses of lake sediment from southwestern Alaska reveal cyclic variations in climate and ecosystems during the Holocene. These variations occurred with periodicities similar to those of solar activity and appear to be coherent with time series of the cosmogenic nuclides 14C and 10Be as well as North Atlantic drift ice. Our results imply that small variations in solar irradiance induced pronounced cyclic changes in northern high-latitude environments. They also provide evidence that centennial-scale shifts in the Holocene climate were similar between the subpolar regions of the North Atlantic and North Pacific, possibly because of Sun-ocean-climate linkages. Holocene climate variability of the Norwegian Atlantic Current during high and low solar insolation forcingBerner et al. 2011 Paleoceanography 26, PA2220A high-resolution sediment core from the Vøring Plateau has been studied to document the centennial to millennial variability of the surface water conditions during the Holocene Climate Optimum (HCO) and the late Holocene period (LHP) in order to evaluate the effects of solar insolation on surface ocean climatology. Quantitative August summer sea surface temperatures (SSSTs) with a time resolution of 2-40 years are reconstructed by using three different diatom transfer function methods. Spectral- and scale-space methods are applied to the records to explore the variability present in the time series at different time scales. The SSST development in core MD95-2011 shows a delayed response to Northern Hemisphere maximum summer insolation at -11,000 years B.P. The record shows the maximum SSST of the HCO to be from 7.3 to 8.9 kyr B.P., which implies that the site was located in the regional warm water pool removed from the oceanic fronts and Arctic waters. Superimposed on the general cooling trend are higher-frequency variabilities at time scales of 80-120, 210-320, 320-640, and 640-1280 years. The climate variations at the time scale of 320-640 years are documented both for periods of high and low solar orbital insolation. We found evidence that the submillennial-scale mode of variability (640-900 years) in SSST evident during the LHP is directly associated with varying solar forcing. At the shorter scale of 260-450 years, the SSST during the LHP displays a lagged response to solar forcing with a phase-locked behavior indicating the existence of a feedback mechanism in the climate system triggered by variations in the solar constant as well as the role of the thermal inertia of the ocean. The abruptness of the cooling events in the LHP, especially pronounced during the onsets of the Holocene Cold Period I (approximately 2300 years B.P.) and the Little Ice Age (approximately 550 years B.P.), can be explained by a shutdown of deep convection in the Nordic Seas in response to negative solar insolation anomalies. These cooling events are on the order of 1.5°C. Diatom-based reconstruction of palaeoceanographic changes on the North Icelandic shelf during the last millenniumRan et al. 2011 Palaeogeography, Palaeoclimatology, Palaeoecology 302 109-119Pronounced palaeoceanographic changes during the last millennium are revealed by high-resolution diatom records from site MD99-2275 on the North Icelandic shelf. There is a high degree of consistency between the reconstructed summer sea surface temperature (SST) record based on diatoms and the instrumental and documentary data during the last 100 years. This confirms the reliability of this proxy for the study of palaeoceanographic and palaeoclimatic changes on the North Icelandic shelf. The present diatom-based summer SST reconstruction shows that the last millennium was characterized by a general cooling trend, but with some fluctuations. Warm and stable conditions with relatively strong influence of the Irminger Current on the North Icelandic shelf are indicated during the interval AD 940-1300, corresponding in time to the Medieval Warm Period (MWP). A considerable cooling at - AD 1300 indicates the transition to the Little Ice Age (LIA) with increased influence of Polar and Arctic water masses deriving from the East Greenland and East Icelandic currents. An extended cooling period between AD 1300 and 1910 is characterized by approximately century-scale oscillations, with marked cold intervals at AD 1325-1375, AD 1460-1500, AD 1610-1670 and AD 1810-1910, separated by relatively mild spells. A two-step warming during the last 100 years is interrupted by three cool events around AD 1920, in the AD 1960s and in the late AD 1990s. In general, the diatom-based indication of palaeoceanographic changes on the North Icelandic shelf during the last millennium corresponds to other proxy-based palaeoclimatic and palaeoceanographic records in the North Atlantic region. Abrupt Holocene climate change and potential response to solar forcing in western CanadaGavin et al. 2011 Quaternary Science Reviews 30, 1243-1255Several abrupt climate events during the Holocene, including the widely documented oscillation at 8.2 thousand years before present (ka), are attributed to changes in the North Atlantic thermohaline circulation. Additional mechanisms, such as interactions between atmospheric circulation, ice-sheet dynamics, and the influence of solar irradiance, also have been proposed to explain abrupt climatic events, but evidence remains elusive. This study presents evidence from multi-proxy analyses on the Holocene sediments of Eleanor Lake, interior British Columbia. Climatic inferences from our decadal-resolution record of biogenic silica (BSi) abundance are supported by changes in diatom and pollen assemblages from the same core and correlations with existing regional climate records. The BSi record reveals abrupt and persistent climatic shifts at 10.2, 9.3, and 8.5 ka, the latter two of which are coeval with major collapses of the Laurentide Ice Sheet. The record also reveals a short-term cooling at 8.2 ka that is distinct from the 8.5 ka event and similar in magnitude to several other late-Holocene coolings. BSi is correlated with solar-irradiance indices (r = 0.43-0.61), but the correlation is opposite in sign to that expected from direct solar forcing and weakens after 8 ka. Possible mechanisms causing the abrupt and persistent climate changes of the early Holocene include 1) sudden losses of ice and proglacial lake extent, causing a shift in the meridional structure of atmospheric circulation, 2) a possible link between solar minima and El Nino-like conditions that are correlated with warm spring temperature in interior British Columbia, and 3) the influence of solar irradiance variability on the position of the polar jet, possibly via effects on the strength of the glacial anticyclone. A new approach to long-term reconstruction of the solar irradiance leads to large historical solar forcingShapiro et al. 2011 Astronomy & AstrophysicsContext. The variable Sun is the most likely candidate for natural forcing of past climate change on time scales of 50 to 1000 years. Evidence for this understanding is that the terrestrial climate correlates positively with solar activity. During the past 10000 years, the Sun has experienced substantial variations in activity and there have been numerous attempts to reconstruct solar irradiance. While there is general agreement on how solar forcing varied during the last several hundred years - all reconstructions are proportional to the solar activity - there is scientific controversy on the magnitude of solar forcing. Solar-forced shifts of the Southern Hemisphere Westerlies during the HoloceneVarma et al. 2011 Climate of the Past 7, 339-347The Southern Hemisphere Westerly Winds (SWW) constitute an important zonal circulation that influences large-scale precipitation patterns and ocean circulation. Variations in their intensity and latitudinal position have been suggested to exert a strong influence on the CO2 budget in the Southern Ocean, thus making them a potential factor affecting the global climate. In the present study, the possible influence of solar forcing on SWW variability during the Holocene is addressed. It is shown that a high-resolution iron record from the Chilean continental slope (41° S), which is interpreted to reflect changes in the position of the SWW, is significantly correlated with reconstructed solar activity during the past 3000 years. In addition, solar sensitivity experiments with a comprehensive global climate model (CCSM3) were carried out to study the response of SWW to solar variability. Taken together, the proxy and model results suggest that centennial-scale periods of lower (higher) solar activity caused equatorward (southward) shifts of the annual mean SWW. Tracking the Atlantic Multidecadal Oscillation through the last 8,000 yearsKnudsen et a. 2011 Nature Communications 2, 178Understanding the internal ocean variability and its influence on climate is imperative for society. A key aspect concerns the enigmatic Atlantic Multidecadal Oscillation (AMO), a feature defined by a 60- to 90-year variability in North Atlantic sea-surface temperatures. The nature and origin of the AMO is uncertain, and it remains unknown whether it represents a persistent periodic driver in the climate system, or merely a transient feature. Here, we show that distinct, c. 55- to 70-year oscillations characterized the North Atlantic ocean-atmosphere variability over the past 8,000 years. We test and reject the hypothesis that this climate oscillation was directly forced by periodic changes in solar activity. We therefore conjecture that a quasi-persistent c. 55- to 70-year AMO, linked to internal ocean-atmosphere variability, existed during large parts of the Holocene. Our analyses further suggest that the coupling from the AMO to regional climate conditions was modulated by orbitally induced shifts in large-scale ocean-atmosphere circulation. Fluctuations in some climate parametersErlykin et al. 2011 Journal of Atmospheric and Solar-Terrestrial Physics 73, 805-809There is argument as to the extent to which there has been an increase over the past few decades in the frequency of the extremes of climatic parameters, such as temperature, storminess, precipitation, etc, an obvious point being that Global Warming might be responsible. Here we report results on those parameters of which we have had experience during the last few years: Global surface temperature, Cloud Cover and the MODIS Liquid Cloud Fraction. In no case we have found indications that fluctuations of these parameters have increased with time. Possible solar forcing of interannual and decadal stratospheric planetary wave variability in the northern hemisphere: An observational studyPowell and Jianjun 2011 Journal of Atmospheric and Solar-Terrestrial Physics 73, 825-838The variability of stratospheric planetary waves and their possible connection with the 11-year solar cycle forcing have been investigated using annual-mean temperatures for the period of 1958-2001 derived from two reanalysis data sets. The significant planetary waves (wavenumbers 1-3) can be identified in the northern mid-high latitudes (55-75 N) in the stratosphere using this data. Comparisons with satellite-retrieved products from the Microwave Sounding Unit (MSU) confirm the significant planetary wave variability seen in the reanalyses. A planetary wave amplitude index (PWAI) is defined to indicate the strength of the stratospheric planetary waves. The PWAI is derived from Fourier analysis of the temperature field for wavenumbers 1-3 and averaged over 55-75 N latitude and the 70-20 hPa layers. The results include two meaningful inter-annual oscillations (2- and 8-year) and one decadal trend (16-year) that was derived from wavelet analysis. The stratospheric temperature structure of the wave amplitudes appear associated with the Arctic Oscillation (AO) which explicitly changed with the PWAI. The temperature gradients between the polar and mid-high latitudes show opposite tendencies between the top-10 strong and weak wave regimes. The variation of the planetary wave amplitude appears closely related to the solar forcing during the recent four solar cycles (20-23). The peak of the 2-year oscillation occurs synchronously with solar minimum, and is consistent with the negative correlation between the PWAI and the observed solar UV irradiance. The UV changes between the maxima and minima of the 11-year solar cycle impact the temperature structure in the middle-lower stratosphere in the mid-high latitudes and hence influence the planetary waves. During solar maximum, the dominant influence appears to be exerted through changes in static stability, leading to a reduction in planetary wave amplitude. During solar minimum, the dominant influence appears to be exerted through changes in the meridional temperature gradient and vertical wind shear, leading to an enhancement of planetary wave amplitude. A 450 year record of spring-summer flood layers in annually laminated sediments from Lake Ammersee (southern Germany)Czymzik et al. 2010 Water Resources Research 46, W11528A 450 year spring-summer flood layer time series at seasonal resolution has been established from the varved sediment record of Lake Ammersee (southern Germany), applying a novel methodological approach. The main results are (1) the attainment of a precise chronology by microscopic varve counting, (2) the identification of detrital layers representing flood-triggered fluxes of catchment material into the lake, and (3) the recognition of the seasonality of these flood layers from their microstratigraphic position within a varve. Tracing flood layers in a proximal and a distal core and correlating them by application of the precise chronology provided information on the depositional processes. Comparing the seasonal flood layer record with daily runoff data of the inflowing River Ammer for the period from 1926 to 1999 allowed the definition of an approximate threshold in flood magnitude above which the formation of flood layers becomes very likely. Moreover, it was possible for the first time to estimate the "completeness" of the flood layer time series and to recognize that mainly floods in spring and summer, representing the main flood seasons in this region, are well preserved in the sediment archive. Their frequency distribution over the entire 450 year time series is not stationary but reveals maxima for colder periods of the Little Ice Age when solar activity was reduced. The observed spring-summer flood layer frequency further shows trends similar to those of the occurrence of flood-prone weather regimes since A.D. 1881, probably suggesting a causal link between solar variability and changes in midlatitude atmospheric circulation patterns. Implications for the low latitude cloud formations from solar activity and the quasi-biennial oscillationHong et al. 2011 Journal of Atmospheric and Solar-Terrestrial Physics 73, 587-591We examined the effect of the 11-year solar cycle and quasi-biennial oscillation (QBO) on the c. 27-day solar rotational period detected in tropical convective cloud activity. We analyzed the data of outgoing longwave radiation (OLR) for AD1979-2004, dividing into four different cases by the combination of high and low solar activities in terms of the 11-year variation, and easterly and westerly stratospheric winds associated with QBO. As a result, c. 27-day variation has been most significantly detected in high solar activity period around the Indo-Pacific Warm Pool. Based on correlation analysis, we find that solar rotation signal can explain 10-20% of OLR variability around the tropical warm pool region during the high solar activity period. The spatial distribution has been, however, apparently different according to the phases of QBO. It is suggested that the 11-year solar cycle and stratospheric QBO have a possibility to cause large-scale oceanic dipole phenomena. The role of atmospheric nuclear explosions on the stagnation of global warming in the mid 20th centuryFujii 2011 Journal of Atmospheric and Solar-Terrestrial Physics 73, 643-652This study suggests that the cause of the stagnation in global warming in the mid 20th century was the atmospheric nuclear explosions detonated between 1945 and 1980. The estimated GST drop due to fine dust from the actual atmospheric nuclear explosions based on the published simulation results by other researchers (a single column model and Atmosphere-Ocean General Circulation Model) has served to explain the stagnation in global warming. Atmospheric nuclear explosions can be regarded as full-scale in situ tests for nuclear winter. The non-negligible amount of GST drop from the actual atmospheric explosions suggests that nuclear winter is not just a theory but has actually occurred, albeit on a small scale. The accuracy of the simulations of GST by IPCC would also be improved significantly by introducing the influence of fine dust from the actual atmospheric nuclear explosions into their climate models; thus, global warming behavior could be more accurately predicted. The unusual minimum of sunspot cycle 23 caused by meridional plasma flow variationsNandy et al. 2011 Nature 471, 80-82Direct observations over the past four centuries show that the number of sunspots observed on the Sun's surface varies periodically, going through successive maxima and minima. Following sunspot cycle 23, the Sun went into a prolonged minimum characterized by a very weak polar magnetic field and an unusually large number of days without sunspots. Sunspots are strongly magnetized regions generated by a dynamo mechanism that recreates the solar polar field mediated through plasma flows. Here we report results from kinematic dynamo simulations which demonstrate that a fast meridional flow in the first half of a cycle, followed by a slower flow in the second half, reproduces both characteristics of the minimum of sunspot cycle 23. Our model predicts that, in general, very deep minima are associated with weak polar fields. Sunspots govern the solar radiative energy and radio flux, and, in conjunction with the polar field, modulate the solar wind, the heliospheric open flux and, consequently, the cosmic ray flux at Earth. A critical look at solar-climate relationships from long temperature seriesLegras et al. 2010 Climate of the Past 6: 745-758A key issue of climate change is to identify the forcings and their relative contributions. The solar-climate relationship is currently the matter of a fierce debate. We address here the need for high quality observations and an adequate statistical approach. A recent work by Le Mouël et al. (2010) and its companion paper by Kossobokov et al. (2010) show spectacular correlations between solar activity and temperature series from three European weather stations over the last two centuries. We question both the data and the method used in these works. We stress (1) that correlation with solar forcing alone is meaningless unless other forcings are properly accounted for and that sunspot counting is a poor indicator of solar irradiance, (2) that long temperature series require homogenization to remove historical artefacts that affect long term variability, (3) that incorrect application of statistical tests leads to interpret as significant a signal which arises from pure random fluctuations. As a consequence, we reject the results and the conclusions of Le Mouël et al. (2010) and Kossobokov et al. (2010). We believe that our contribution bears some general interest in removing confusion from the scientific debate. Influence of solar activity on the state of the wheat market in medieval EnglandPustil'nik and Yom Din 2004 Solar Physics 223: 335-356The database of professor Rogers (1887), which includes wheat prices in England in the Middle Ages, was used to search for a possible influence of solar activity on the wheat market. Our approach was based on the following: (1) Existence of the correlation between cosmic ray flux entering the terrestrial atmosphere and cloudiness of the atmosphere. (2) Cosmic ray intensity in the solar system changes with solar activity. (3) Wheat production depends on weather conditions as a nonlinear function with threshold transitions. (4) A wheat market with a limited supply (as it was in medieval England) has a highly nonlinear sensitivity to variations in wheat production with boundary states, where small changes in wheat supply could lead to bursts of prices or to prices falling. We present a conceptual model of possible modes for sensitivity of wheat prices to weather conditions, caused by solar cycle variations, and compare expected price fluctuations with price variations recorded in medieval England. We compared statistical properties of the intervals between wheat price bursts during the years 1249-1703 with statistical properties of the intervals between the minima of solar cycles during the years 1700-2000. We show that statistical properties of these two samples are similar, both for characteristics of the distributions and for histograms of the distributions. We analyze a direct link between wheat prices and solar activity in the 17th century, for which wheat prices and solar activity data (derived from 10 Be isotope) are available. We show that for all 10 time moments of the solar activity minima the observed prices were higher than prices for the corresponding time moments of maximal solar activity (100% sign correlation, on a significance level 0.2%). We consider these results a direct evidence of the causal connection between wheat prices bursts and solar activity. Space climate manifestation in earth prices - from medieval England up to modern U.S.A.Pustil'nik and Yom Din 2005 Solar Physics 224: 473-481In this study we continue to search for possible manifestations of space weather influence on prices of agricultural products and consumables. We note that the connection between solar activity and prices is based on the causal chain that includes several nonlinear transition elements. These nonlinear elements are characterized by threshold sensitivity to external parameters and lead to very inhomogeneous local sensitivity of the price to space weather conditions. It is noted that "soft type" models are the most adequate for description of this class of connections. Two main observational effects suitable for testing causal connections of this type of sensitivity are considered: burst-like price reactions on changes in solar activity and price asymmetry for selected phases of the sunspot cycle. The connection, discovered earlier for wheat prices of Medieval England, is examined in this work on the basis of another 700-year data set of consumable prices in England. Using the same technique as in the previous part of our work (Pustilnik and Yom Din, 2004) we show that statistical parameters of the interval distributions for price bursts of consumable basket and for sunspot minimum states are similar to one another, as was reported earlier for wheat price bursts. Possible sources of these consistencies between three different multiyear samples are discussed. For a search of possible manifestations of the 'space weather - wheat market' connection in modern time, we analyze dynamics of wheat prices in the U.S.A. in the twentieth century. We show that the wheat prices revealed a maximum/minimum price asymmetry consistent with the phases of the sunspot cycle. We discuss possible explanations of this observed asymmetry, unexpected under conditions of globalization of the modern wheat market. Influence of human and natural forcing on European seasonal temperaturesHegerl et al. 2011 Nature Geoscience 4: 99-103It is the regional and seasonal expression of climate change that determines the effect of greenhouse warming on ecosystemsand society. Whereas anthropogenic influences on European temperatures have been detected over the twentieth century, it has been suggested that the impact of external influences on European temperatures before 1900 is negligible. Here we use reconstructions of seasonal European land temperature and simulations with three global climate models to show that external influences on climate-such as the concentrations of stratospheric volcanic aerosols or greenhouse gases, other anthropogenic effects and possibly changes in total solar irradiance-have had a discernible influence on European temperatures throughout the past five centuries. In particular, we find that external forcing contributes significantly (p5%) to the reconstructed long-term variability of winter and spring temperatures and that it is responsible for a best guess of 75% of the observed winter warming since the late seventeenth century. This warming is largely attributable to greenhouse-gas forcing. Summer temperatures show detectable (p5%) interdecadal variations in response to external forcing before 1900 only. Finally, throughout the record we detect highly significant summer cooling and significant winter warming following volcanic eruptions. Solar Cycle PredictionPetrovay, 2011 Living Rev. Solar Phys. 7, (2010), 6A review of solar cycle prediction methods and their performance is given, including forecasts for cycle 24. The review focuses on those aspects of the solar cycle prediction problem that have a bearing on dynamo theory. The scope of the review is further restricted to the issue of predicting the amplitude (and optionally the epoch) of an upcoming solar maximum no later than right after the start of the given cycle. Prediction methods form three main groups. Precursor methods rely on the value of some measure of solar activity or magnetism at a specified time to predict the amplitude of the following solar maximum. Their implicit assumption is that each numbered solar cycle is a consistent unit in itself, while solar activity seems to consist of a series of much less tightly intercorrelated individual cycles. Extrapolation methods, in contrast, are based on the premise that the physical process giving rise to the sunspot number record is statistically homogeneous, i.e., the mathematical regularities underlying its variations are the same at any point of time and, therefore, it lends itself to analysis and forecasting by time series methods. Finally, instead of an analysis of observational data alone, model based predictions use physically (more or less) consistent dynamo models in their attempts to predict solar activity. In their overall performance during the course of the last few solar cycles, precursor methods have clearly been superior to extrapolation methods. Nevertheless, most precursor methods overpredicted cycle 23, while some extrapolation methods may still be worth further study. Model based forecasts have not yet had a chance to prove their skills. One method that has yielded predictions consistently in the right range during the past few solar cycles is that of K. Schatten et al., whose approach is mainly based on the polar field precursor. The incipient cycle 24 will probably mark the end of the Modern Maximum, with the Sun switching to a state of less strong activity. It will therefore be an important testbed for cycle prediction methods and, by inference, for our understanding of the solar dynamo. How the solar dynamics can influence the Sun-Earth medium term relationshipTurck-Chieze and Lefebvre, 2011 Journal of Atmospheric and Solar-Terrestrial Physics 73, 251-257We recall how the Sun is introduced in the present climatic models and discuss why the solar standard model (SSM) framework is insufficient to describe the Sun-Earth medium term relationship. We then report on the different sources of variability. The SoHO mission allows a comparison between two successive solar minima and puts new constraints on the internal rotation profile. The coming space missions SDO and PICARD will add crucial information on internal circulations and on the superficial asphericity. The interplay between the solar dynamics and terrestrial atmospheric models is in its infancy, it calls for medium term uninterrupted solar observations which will take benefit of a formation flying concept. Long-term solar activity influences on South American riversMauas et al. 2011 Journal of Atmospheric and Solar-Terrestrial Physics 73, 377-382River streamflows are excellent climatic indicators since they integrate precipitation over large areas. Here we follow up on our previous study of the influence of solar activity on the flow of the Parana River, in South America. We find that the unusual minimum of solar activity in recent years have a correlation on very low levels in the Parana's flow, and we report historical evidence of low water levels during the Little Ice Age. We also study data for the streamflow of three other rivers (Colorado, San Juan and Atuel), and snow levels in the Andes. We obtained that, after eliminating the secular trends and smoothing out the solar cycle, there is a strong positive correlation between the residuals of both the Sunspot Number and the streamflows, as we obtained for the Parana. Both results put together imply that higher solar activity corresponds to larger precipitation, both in summer and in wintertime, not only in the large basin of the Parana, but also in the Andean region north of the limit with Patagonia. Variations in tree ring stable isotope records from northern Finland and their possible connection to solar activityOgurtsov et al. 2011 Journal of Atmospheric and Solar-Terrestrial Physics 73, 383-387Within a project on climate in Europe during the past few hundred years we have collected a record on stable isotope ratios 13C/12C and 18O/16O in tree ring cellulose from pine trees in northern Finland. The records cover the time interval 1600-2002 AD and have an annual time resolution. The carbon stable isotope record from northernmost Finland correlates quite strongly with local growth period temperature. Statistical analysis of the carbon and oxygen stable isotope records reveals variations in the periods around 100, 11 and 3 years. A century scale connection between the 13C/12C record and solar activity is most evident. These results based on stable isotope records support previous evidences of a centennial solar-climatic link obtained for northern Finland using tree ring data. Variations in climate parameters at time intervals from hundreds to tens of millions of years in the past and its relation to solar activityRaspopov et al. 2011 Journal of Atmospheric and Solar-Terrestrial Physics 73, 388-399Unique palaeoclimatic data with annual time resolution as tree ring widths and annual varve deposits are analyzed in order to reveal periodicities in climatic processes at tens to hundreds of million years ago. The climatic periodicities thus found are compared with the solar and climatic periodicities observed at present. Orbital, ice sheet, and possible solar controls on Holocene moisture trends in the North Atlantic drainage basinShuman and Plank 2011 Geology 39, 151-154Holocene patterns of hydroclimatic change in the North Atlantic region are poorly understood despite the importance to climate of the region's freshwater flux to the ocean. Here we reconstruct the history of moisture balance in the North Atlantic drainage by compiling lake-level records from 95 lakes in Europe and North America. We show that recent millennia were significantly wetter than much of the Holocene in both regions. Only 15% of lakes studied in the North Atlantic basin were low in the past millennium. In contrast, 50% of lakes were low at 10 cal kyr B.P. Low moisture levels in the early Holocene likely resulted from high summer and fall insolation and the influence of the continental ice sheets; water levels rose in many areas as these influences diminished. A principal components analysis of the lake-level data, however, also indicates that Holocene atmospheric circulation changes, possibly driven by solar activity, generated additional moisture variation, including low water levels at 5-2 cal kyr B.P. in eastern North America and Scandinavia. Response of Norwegian Sea temperature to solar forcing since 1000 A.D.Sejrup et al. 2010 Journal of Geophysical Research 115, C12034We report on a 1000 year long oxygen isotope record in sediments of the eastern Norwegian Sea which, we argue, represents the temperature and transport of warm Atlantic waters entering the Nordic Sea basin via the North Atlantic Drift and the large-scale Meridional Overturning Circulation. The single-sample resolution of the record is 2.5-10 years and age control is provided by 210Pb and 137Cs dating, identification of historic tephra, and a 14C "wiggle-match" dating method in which the surface reservoir 14C age in the past is constrained rather than assumed, thereby eliminating a large source of chronological uncertainty. The oxygen isotope results indicate decade- to century-scale temperature variations of 12 C in the shallow (-50 m deep) subsurface which we find to be strongly correlated with various proxies of past solar activity. The correlations are synchronous to within the timescale uncertainties of the ocean and solar proxy records, which vary among the records and in time with a range of about 5-30 years. The observed ocean temperature response is larger than expected based on simple thermodynamic considerations, indicating that there is dynamical response of the high-latitude ocean to the Sun. Correlations of our results with a gridded temperature reconstruction for Europe are greater in central Europe than in coastal regions, suggesting that the temperature and transport of warm Atlantic waters entering the Nordic Basin and the pattern of temperature variability over Europe are both the proximate responses to a change in the atmospheric circulation, consistent with a forced shift in the primary modes of high-latitude atmospheric variability. On the recovery from the Little Ice AgeAkasofu, 2010 Natural Science 2, 1211-1224A number of published papers and openly available data on sea level changes, glacier retreat, freezing/break-up dates of rivers, sea ice retreat, tree-ring observations, ice cores and changes of the cosmic-ray intensity, from the year 1000 to the present, are studied to examine how the Earth has recovered from the Little Ice Age (LIA). We learn that the recovery from the LIA has proceeded continuously, roughly in a linear manner, from 1800-1850 to the present. The rate of the recovery in terms of temperature is about 0.5 C/100 years and thus it has important implications for understanding the present global warming. It is suggested, on the basis of a much longer period data, that the Earth is still in the process of recovery from the LIA; there is no sign to indicate the end of the recovery before 1900. Cosmic-ray intensity data show that solar activity was related to both the LIA and its recovery. The multi-decadal oscillation of a period of 50 to 60 years was superposed on the linear change; it peaked in 1940 and 2000, causing the halting of warming temporarily after 2000. These changes are natural changes, and in order to determine the contribution of the manmade greenhouse effect, there is an urgent need to identify them correctly and accurately and remove them from the present global warming/cooling trend. Vísindagreinar frá árinu 2010Global cooling in the immediate future?Wang et al. 2010 Chinese Science Bulletin 55, 3847-3852New perspectives regarding the possible cooling of the Earth's climate as a result of solar changes are reviewed in this paper. The major findings include: (1) solar activity is weakening to its very low level, which is comparable with the level in the early 20th century; (2) the current grand solar maximum has already lasted for eight 11-year solar cycles and might end in the coming one/two 11-year cycles; (3) a grand solar minimum might prevail in the next 100-200 years; and (4) the number of sunspots in the coming solar maximum (M)-year, around 2013, is an important indicator that needs to be closely monitored. Dynamical Response of the Tropical Pacific Ocean to Solar Forcing During the Early HoloceneMarchitto et al. 2010 Science 330, 1378-1381We present a high-resolution magnesium/calcium proxy record of Holocene sea surface temperature (SST) from off the west coast of Baja California Sur, Mexico, a region where interannual SST variability is dominated today by the influence of the El Nino-Southern Oscillation (ENSO). Temperatures were lowest during the early to middle Holocene, consistent with documented eastern equatorial Pacific cooling and numerical model simulations of orbital forcing into a La Nina-like state at that time. The early Holocene SSTs were also characterized by millennial-scale fluctuations that correlate with cosmogenic nuclide proxies of solar variability, with inferred solar minima corresponding to El Nino-like (warm) conditions, in apparent agreement with the theoretical "ocean dynamical thermostat" response of ENSO to exogenous radiative forcing. Enhanced signature of solar variability in Eurasian winter climateWoollings et al. 2010s Geophys. Res. Lett.We demonstrate that open solar flux (Fs, derivable from geomagnetic data) exhibits stronger correlations with atmospheric circulation variations than conventionally-used measures of solar activity. The circulation anomalies are particularly enhanced over the North Atlantic / Eurasian sector, where there are large changes in the occurrence of blocking and the winter mean surface temperature differs by several degrees between high- and low-solar terciles. The relationship is stronger and simpler for Fs, being more linear between high- and low-solar winters. While the circulation anomalies strongly resemble the North Atlantic Oscillation they also extend deeper into Eurasia, especially in high-solar conditions. This distinct signature may be useful for the detection and attribution of observed changes and also the identification of dynamical mechanisms. Synchronized Northern Hemisphere climate change and solar magnetic cycles during the Maunder MinimumYamaguchi et al. 2010 PNASThe Maunder Minimum (A.D. 1645-1715) is a useful period to investigate possible sun-climate linkages as sunspots became exceedingly rare and the characteristics of solar cycles were different from those of today. Here, we report annual variations in the oxygen isotopic composition (d18O) of tree-ring cellulose in central Japan during the Maunder Minimum. We were able to explore possible sun-climate connections through high-temporal resolution solar activity (radiocarbon contents; d14C) and climate (d18O) isotope records derived from annual tree rings. The tree-ring d18O record in Japan shows distinct negative d18O spikes (wetter rainy seasons) coinciding with rapid cooling in Greenland and with decreases in Northern Hemisphere mean temperature at around minima of decadal solar cycles. We have determined that the climate signals in all three records strongly correlate with changes in the polarity of solar dipole magnetic field, suggesting a causal link to galactic cosmic rays (GCRs). These findings are further supported by a comparison between the interannual patterns of tree-ring d18O record and the GCR flux reconstructed by an ice-core 10Be record. Therefore, the variation of GCR flux associated with the multidecadal cycles of solar magnetic field seem to be causally related to the significant and widespread climate changes at least during the Maunder Minimum. Cosmic rays linked to rapid mid-latitude cloud changesLaken et al., 2010 Atmospheric Chemistry and Physics 10, 10941-10948The effect of the Galactic Cosmic Ray (GCR) flux on Earth's climate is highly uncertain. Using a novel sampling approach based around observing periods of significant cloud changes, a statistically robust relationship is identified between short-term GCR flux changes and the most rapid mid-latitude (60-30 N/S) cloud decreases operating over daily timescales; this signal is verified in surface level air temperature (SLAT) reanalysis data. A General Circulation Model (GCM) experiment is used to test the causal relationship of the observed cloud changes to the detected SLAT anomalies. Results indicate that the anomalous cloud changes were responsible for producing the observed SLAT changes, implying that if there is a causal relationship between significant decreases in the rate of GCR flux (c. 0.79 GU, where GU denotes a change of 1% of the 11-year solar cycle amplitude in four days) and decreases in cloud cover (c. 1.9 CU, where CU denotes a change of 1% cloud cover in four days), an increase in SLAT (c. 0.05 KU, where KU denotes a temperature change of 1 K in four days) can be expected. The influence of GCRs is clearly distinguishable from changes in solar irradiance and the interplanetary magnetic field. However, the results of the GCM experiment are found to be somewhat limited by the ability of the model to successfully reproduce observed cloud cover. These results provide perhaps the most compelling evidence presented thus far of a GCR-climate relationship. From this analysis we conclude that a GCR-climate relationship is governed by both short-term GCR changes and internal atmospheric precursor conditions. Solar influences on climateGray et al. 2010 Reviews of Geophysics, 48, RG4001Understanding the influence of solar variability on the Earth's climate requires knowledge of solar variability, solar-terrestrial interactions, and the mechanisms determining the response of the Earth's climate system. We provide a summary of our current understanding in each of these three areas. Observations and mechanisms for the Sun's variability are described, including solar irradiance variations on both decadal and centennial time scales and their relation to galactic cosmic rays. Corresponding observations of variations of the Earth's climate on associated time scales are described, including variations in ozone, temperatures, winds, clouds, precipitation, and regional modes of variability such as the monsoons and the North Atlantic Oscillation. A discussion of the available solar and climate proxies is provided. Mechanisms proposed to explain these climate observations are described, including the effects of variations in solar irradiance and of charged particles. Finally, the contributions of solar variations to recent observations of global climate change are discussed. Evidence for progressive Holocene aridification in southern Africa recorded in Namibian hyrax middens: Implications for African Monsoon dynamics and the "African Humid Period"Chase et al., 2010 Quaternary Research 74, 36-45Presented here are stable nitrogen isotope data from a rock hyrax (Procavia capensis) middens from northwestern Namibia that record a series of rapid aridification events beginning at ca. 3800 cal yr BP, and which mark a progressive decrease in regional humidity across the Holocene. Strong correlations exist between this record and other terrestrial and marine archives from southern Africa, indicating that the observed pattern of climate change is regionally coherent. Combined, these data indicate hemispheric synchrony in tropical African climate change during the Holocene, with similar trends characterising the termination of the 'African Humid Period' (AHP) in both the northern and southern tropics. These findings run counter to the widely accepted model of direct low-latitude insolation forcing, which requires an anti-phase relationship to exist between the hemispheres. The combined dataset highlights: 1) the importance of forcing mechanisms influencing the high northern latitudes in effecting low-latitude climate change in Africa, and 2) the potential importance of solar forcing and variations in the Earth's geomagnetic shield in determining both long-term and rapid centennial-scale climate changes, identifying a possible mechanism for the variations marking the AHP termination in both the southern and northern tropics. Anomalously low solar extreme-ultraviolet irradiance and thermospheric density during solar minimumSolomon et al. 2010 Geophysical Research Letters 37, L16103Solar activity during 2007-2009 was very low, and during this protracted solar minimum period, the terrestrial thermosphere was cooler and lower in density than expected. Measurements from instruments on the SOHO and TIMED spacecraft, and by suborbital rocket flights, indicate that solar extreme-ultraviolet irradiance levels were lower than they were during the previous solar minimum. Analysis of atmospheric drag on satellite orbits indicate that the thermosphere was lower in density, and therefore cooler, and than at any time since the beginning of the space age. However, secular change due to increasing levels of carbon dioxide and other greenhouse gases, which cool the upper atmosphere, also plays a role in thermospheric climate. Simulations by the NCAR Thermosphere-Ionosphere-Electrodynamics General Circulation Model are compared to thermospheric density measurements, yielding evidence that the primary cause of the low thermospheric density was the unusually low level of solar extreme-ultraviolet irradiance. An influence of solar spectral variations on radiative forcing of climateHaigh et al. 2010 Nature 467, 696-699The thermal structure and composition of the atmosphere is determined fundamentally by the incoming solar irradiance. Radiation at ultraviolet wavelengths dissociates atmospheric molecules, initiating chains of chemical reactions-specifically those producing stratospheric ozone-and providing the major source of heating for the middle atmosphere, while radiation at visible and near-infrared wavelengths mainly reaches and warms the lower atmosphere and the Earth's surface. Thus the spectral composition of solar radiation is crucial in determining atmospheric structure, as well as surface temperature, and it follows that the response of the atmosphere to variations in solar irradiance depends on the spectrum. Daily measurements of the solar spectrum between 0.2 um and 2.4 um, made by the Spectral Irradiance Monitor (SIM) instrument on the Solar Radiation and Climate Experiment (SORCE) satellite since April 2004, have revealed that over this declining phase of the solar cycle there was a four to six times larger decline in ultraviolet than would have been predicted on the basis of our previous understanding. This reduction was partially compensated in the total solar output by an increase in radiation at visible wavelengths. Here we show that these spectral changes appear to have led to a significant decline from 2004 to 2007 in stratospheric ozone below an altitude of 45 km, with an increase above this altitude. Our results, simulated with a radiative-photochemical model, are consistent with contemporaneous measurements of ozone from the Aura-MLS satellite, although the short time period makes precise attribution to solar effects difficult. We also show, using the SIM data, that solar radiative forcing of surface climate is out of phase with solar activity. Currently there is insufficient observational evidence to validate the spectral variations observed by SIM, or to fully characterize other solar cycles, but our findings raise the possibility that the effects of solar variability on temperature throughout the atmosphere may be contrary to current expectations. Natural forcing of climate during the last millennium: fingerprint of solar variability -- Low frequency solar forcing and NAOSwingedouw et al. 2010 Climate DynamicsThe variability of the climate during the last millennium is partly forced by changes in total solar irradiance (TSI). Nevertheless, the amplitude of these TSI changes is very small so that recent reconstruction data suggest that low frequency variations in the North Atlantic Oscillation (NAO) and in the thermohaline circulation may have amplified, in the North Atlantic sector and mostly in winter, the radiative changes due to TSI variations. In this study we use a state-of-the-art climate model to simulate the last millennium. We find that modelled variations of surface temperature in the Northern Hemisphere are coherent with existing reconstructions. Moreover, in the model, the low frequency variability of this mean hemispheric temperature is found to be correlated at 0.74 with the solar forcing for the period 1001-1860. Then, we focus on the regional climatic fingerprint of solar forcing in winter and find a significant relationship between the low frequency TSI forcing and the NAO with a time lag of more than 40 years for the response of the NAO. Such a lag is larger than the around 20-year lag suggested in other studies. We argue that this lag is due, in the model, to a northward shift of the tropical atmospheric convection in the Pacific Ocean, which is maximum more than four decades after the solar forcing increase. This shift then forces a positive NAO through an atmospheric wave connection related to the jet-stream wave guide. The shift of the tropical convection is due to the persistence of anomalous warm SST forcing the anomalous precipitation, associated with the advection of warm SST by the North Pacific subtropical gyre in a few decades. Finally, we analyse the response of the Atlantic meridional overturning circulation to solar forcing and find that the former is weakened when the latter increases. Changes in wind stress, notably due to the NAO, modify the barotropic streamfunction in the Atlantic 50 years after solar variations. This implies a wind-driven modification of the oceanic circulation in the Atlantic sector in response to changes in solar forcing, in addition to the variations of the thermohaline circulation. Solar Minima, Earth's rotation and Little Ice Ages in the past and in the future: The North Atlantic-European caseMörner, 2010 Global and Planetary Change 72, 282-293The past Solar Minima were linked to a general speeding up of the Earth's rate of rotation. This affected the surface currents and southward penetration of Arctic water in the North Atlantic causing "Little Ice Ages" over northwestern Europe. At around 2040-2050 we will be in a new major Solar Minimum. It is to be expected that we will then have a new "Little Ice Age" over the Arctic and NW Europe. The mechanism proposed for the linkage of Solar activity with Earth's rotation is the interaction of Solar Wind with the Earth's magnetosphere; the decrease in Solar Wind at sunspot minima weakens the interaction with the magnetosphere that allows the Earth to speed up, and the increase in Solar Wind at sunspot maxima strengthens the interaction with the magnetosphere that slows down the spinning of the Earth. External forcing as a metronome for Atlantic multidecadal variabilityOtterå et al. 2010 Nature Geoscience 3, 688-694Instrumental records, proxy data and climate modelling show that multidecadal variability is a dominant feature of North Atlantic sea-surface temperature variation with potential impacts on regional climate. To understand the observed variability and to gauge any potential for climate predictions it is essential to identify the physical mechanisms that lead to this variability, and to explore the spatial and temporal characteristics of multidecadal variability modes. Here we use a coupled ocean-atmosphere general circulation model to show that the phasing of the multidecadal fluctuations in the North Atlantic during the past 600 years is, to a large degree, governed by changes in the external solar and volcanic forcings. We find that volcanoes play a particularly important part in the phasing of the multidecadal variability through their direct influence on tropical sea-surface temperatures, on the leading mode of northern-hemisphere atmosphere circulation and on the Atlantic thermohaline circulation. We suggest that the implications of our findings for decadal climate prediction are twofold: because volcanic eruptions cannot be predicted a decade in advance, longer-term climate predictability may prove challenging, whereas the systematic post-eruption changes in ocean and atmosphere may hold promise for shorter-term climate prediction. Reconstruction of solar UV irradiance since 1974Krivova et al. 2009 JOURNAL OF GEOPHYSICAL RESEARCH, VOL. 114, D00I04Variations of the solar UV irradiance are an important driver of chemical and physical processes in the Earth's upper atmosphere and may also influence global climate. Here we reconstruct solar UV irradiance in the range 115-400 nm over the period 1974-2007 by making use of the recently developed empirical extension of the Spectral And Total Irradiance Reconstruction (SATIRE) models employing Solar Ultraviolet Spectral Irradiance Monitor (SUSIM) data. The evolution of the solar photospheric magnetic flux, which is a central input to the model, is described by the magnetograms and continuum images recorded at the Kitt Peak National Solar Observatory between 1974 and 2003 and by the Michelson Doppler Imager instrument on SOHO since 1996. The reconstruction extends the available observational record by 1.5 solar cycles. The reconstructed Ly-a irradiance agrees well with the composite time series by Woods et al. (2000). The amplitude of the irradiance variations grows with decreasing wavelength and in the wavelength regions of special interest for studies of the Earth's climate (Ly-a and oxygen absorption continuum and bands between 130 and 350 nm) is 1-2 orders of magnitude stronger than in the visible or if integrated over all wavelengths (total solar irradiance). On the remarkable Arctic winter in 2008/2009Labitzke and Kunze 2010 JOURNAL OF GEOPHYSICAL RESEARCH, VOL. 114, D00I02It is well known that the interannual variability of the stratospheric winters over the Arctic is very large. On the basis of data for more than 60 winters, this variability has been studied with the aim of understanding and possibly forecasting the type of the coming winter, in the stratosphere and also in the troposphere. Today, there is general agreement that the variability of the stratospheric circulation during the Arctic winters is influenced by different forcing mechanisms: by the tropospheric planetary waves which penetrate into the stratosphere, by the Quasi-Biennial Oscillation (QBO) and the Southern Oscillation (SO) in the tropics which influence the stratospheric polar vortex, and by the 11-year sunspot cycle which interacts with the QBO and probably also with the SO. For the winter 2008/2009, all of the known signals pointed to a stable, cold stratospheric polar vortex throughout the winter, but in the real atmosphere a major midwinter warming developed in January and February with record-breaking temperatures. The synoptics of this winter will be discussed in the context of all of the above-mentioned forcing mechanisms. Stratospheric and solar cycle effects on long-term variability of mesospheric ice cloudsLübcken et al. 2009 JOURNAL OF GEOPHYSICAL RESEARCH, VOL. 114, D00I06Model results of mesospheric ice layers and background conditions at 69N from 1961 to 2008 are analyzed. The model nudges to European Centre for Medium-Range Weather Forecasts data below -45 km. Greenhouse gas concentrations in the mesosphere are kept constant. At polar mesospheric cloud (PMC) altitudes (83 km) temperatures decrease until the mid 1990s by -0.08 K/yr resulting in trends of PMC brightness, occurrence rates, and, to a lesser extent, in PMC altitudes (-0.0166 km/yr). Ice layer trends are consistent with observations by ground-based and satellite instruments. Water vapor increases at PMC heights and decreases above due to increased freeze-drying caused by the temperature trend. Temperature trends in the mesosphere mainly come from shrinking of the stratosphere and from dynamical effects. A solar cycle modulation of H2O is observed in the model consistent with satellite observations. The effect on ice layers is reduced because of redistribution of H2O by freeze-drying. The accidental coincidence of low temperatures and solar cycle minimum in the mid 1990s leads to an overestimation of solar effects on ice layers. A strong correlation between temperatures and PMC altitudes is observed. Applied to historical measurements this gives negligible temperature trends at PMC altitudes (-0.01-0.02 K/yr). Strong correlations between PMC parameters and background conditions deduced from the model confirm the standard scenario of PMC formation. The PMC sensitivity on temperatures, water vapor, and Ly-a is investigated. PMC heights show little variation with background parameters whereas brightness and occurrence rates show large variations. None of the background parameters can be ignored regarding its influence on ice layers. Transient climate simulations from the Maunder Minimum to present day: Role of the stratosphereSpangehl et al. 2010 JOURNAL OF GEOPHYSICAL RESEARCH, VOL. 115, D00I10Transient climate simulations are performed covering the period from 1630 to 2000. A vertically extended version of a coupled atmosphere-ocean general circulation model is used, including a detailed representation of the stratosphere. One simulation is driven by changes in total solar irradiance due to solar activity as well as volcanic eruptions and changes in greenhouse gas (GHG) concentrations. A second simulation additionally includes changes in short-wave heating due to prescribed photochemical changes in ozone. The simulations are compared with reconstructions and other simulations employing less resolved stratosphere. The inclusion of the higher resolved stratosphere plays only a moderate role for the simulated climate variability on the hemispheric scale. Larger implications are found for regional scales. Both simulations reveal a shift of the North Atlantic Oscillation toward a more positive phase from the Maunder Minimum to present day, mainly attributed to anthropogenic increase in concentration of well-mixed GHG. Increase in GHG is related to a more disturbed stratospheric polar vortex resulting in an only moderate strengthening of tropospheric westerlies over Europe compared with the tropospheric version of the model. On multidecadal to centennial time scales the stratospheric solar forcing substantially contributes to the climate change signal in the stratosphere, and there is clear evidence for an impact on the tropospheric circulation. Top-down solar modulation of climate: evidence for centennial-scale changeLockwood et al. 2010 Environ. Res. Lett. 5 034008During the descent into the recent 'exceptionally' low solar minimum, observations have revealed a larger change in solar UV emissions than seen at the same phase of previous solar cycles. This is particularly true at wavelengths responsible for stratospheric ozone production and heating. This implies that 'top-down' solar modulation could be a larger factor in long-term tropospheric change than previously believed, many climate models allowing only for the 'bottom-up' effect of the less-variable visible and infrared solar emissions. We present evidence for long-term drift in solar UV irradiance, which is not found in its commonly used proxies. In addition, we find that both stratospheric and tropospheric winds and temperatures show stronger regional variations with those solar indices that do show long-term trends. A top-down climate effect that shows long-term drift (and may also be out of phase with the bottom-up solar forcing) would change the spatial response patterns and would mean that climate-chemistry models that have sufficient resolution in the stratosphere would become very important for making accurate regional/seasonal climate predictions. Our results also provide a potential explanation of persistent palaeoclimate results showing solar influence on regional or local climate indicators. Is solar variability reflected in the Nile River?Ruzmaikin et al. 2006 JOURNAL OF GEOPHYSICAL RESEARCH, VOL. 111, D21114We investigate the possibility that solar variability influences North African climate by using annual records of the water level of the Nile collected in 622-1470 A.D. The time series of these records are nonstationary, in that the amplitudes and frequencies of the quasi-periodic variations are time-dependent. We apply the Empirical Mode Decomposition technique especially designed to deal with such time series. We identify two characteristic timescales in the records that may be linked to solar variability: a period of about 88 years and one exceeding 200 years. We show that these timescales are present in the number of auroras reported per decade in the Northern Hemisphere at the same time. The 11-year cycle is seen in the Nile's high-water level variations, but it is damped in the low-water anomalies. We suggest a possible physical link between solar variability and the low-frequency variations of the Nile water level. This link involves the influence of solar variability on the atmospheric Northern Annual Mode and on its North Atlantic Ocean and Indian Ocean patterns that affect the rainfall over the sources of the Nile in eastern equatorial Africa. The pattern of northern hemisphere surface air temperature during prolonged periods of low solar outputRuzmaikin et al. 2004 GEOPHYSICAL RESEARCH LETTERS, VOL. 31, L12201We show that the reconstructed sensitivity of the sea level temperature to long term solar forcing in the Northern Hemisphere is in very good agreement with the empirical temperature pattern corresponding to changes of the North Annular Mode (NAM). This implies that long-term variations of solar output affect climate predominantly through the NAM that extends throughout the stratosphere and troposphere. Effect of solar variability on the Earth's climate patternsRuzmaikin 2007 Advances in Space Research 40: 1146-1151We discuss effects of solar variability on the Earth's large-scale climate patterns. These patterns are naturally excited as deviations (anomalies) from the mean state of the Earth's atmosphere-ocean system. We consider in detail an example of such a pattern, the North Annular Mode (NAM), a climate anomaly with two states corresponding to higher pressure at high latitudes with a band of lower pressure at lower latitudes and the other way round. We discuss a mechanism by which solar variability can influence this pattern and formulate an updated general conjecture of how external influences on Earth's dynamics can affect climate patterns. Has solar variability caused climate change that affected human culture?Feynman, 2007 Advances in Space Research 40: 1173-1180If solar variability affects human culture it most likely does so by changing the climate in which the culture operates. Variations in the solar radiative input to the Earth's atmosphere have often been suggested as a cause of such climate change on time scales from decades to tens of millennia. In the last 20 years there has been enormous progress in our knowledge of the many fields of research that impinge on this problem; the history of the solar output, the effect of solar variability on the Earth's mean climate and its regional patterns, the history of the Earth's climate and the history of mankind and human culture. This new knowledge encourages revisiting the question asked in the title of this talk. Several important historical events have been reliably related to climate change including the Little Ice Age in northern Europe and the collapse of the Classical Mayan civilization in the 9th century AD. In the first section of this paper we discus these historical events and review the evidence that they were caused by changes in the solar output. Perhaps the most important event in the history of mankind was the development of agricultural societies. This began to occur almost 12,000 years ago when the climate changed from the Pleistocene to the modern climate of the Holocene. In the second section of the paper we will discuss the suggestion (Feynman and Ruzmaikin, 2007) that climate variability was the reason agriculture developed when it did and not before. Future climate change and the British Quaternary research communityMcCarroll, 2010 Quaternary Science Reviews 29: 1661-1672The uncertainty surrounding estimates of future global warming, even given a single scenario for increasing greenhouse gas emissions, is unacceptably large and has not declined substantially over the last three decades. The Quaternary science community is uniquely placed to constrain the array of possible futures by providing reconstructions of past climate that can be used, together with instrumental data, to weight the model variants in perturbed physics ensembles, which accept the uncertainty in many of the model parameters. The models which give the best fit with the climate of the past can then be given most weight when projected into the future. Computing resources have restricted such experiments to relatively simple models, so that information on spatial differences in palaeoclimate could not be fully exploited. Within a few years it will be possible to apply this method to complex general circulation models, so if the Quaternary community acts now it will be possible to supply the information that is required. The best time period to use is the last one to two thousand years. The wider the range of climate parameters that can be reconstructed, and the wider the range of locations, the more constraint will be provided. To be useful, the palaeoclimate reconstructions need to have realistic estimates of uncertainty, so a clear emphasis on replication, calibration and verification will be required. Reconstruction of the Earth's surface temperature based on data of deep boreholes, global warming in the last millennium, and long-term solar cyclicity. Part 1. Experimental dataDergachev and Raspopov, 2010 Geomagnetism and Aeronomy 50, 383-393The effect of the natural factors (solar activity) on the long-term variations of global temperatures has been analyzed based on studying the borehole thermal regime in a time interval of 1000 years ago. It has been indicated that the temperatures started rising about 500 rather than 150 years ago as adherents of the anthropogenic impact on climate consider. The temperature maximum, the amplitude of which is larger than the present-day rise of temperature, is determined about 1000 years ago. The appearance of this maximum corresponds to the time interval of a long-term increase in solar activity according to the data of the 14C and 10Be cosmogenic isotopes. The stabilization of the global temperature in the last decades at a constant increase in the amount of greenhouse gases in the atmosphere contradicts the concept, according to which an increase in the global temperature in the last decades is only explained by the anthropogenic impact. Reconstruction of the Earth's surface temperature based on data of deep boreholes, global warming in the last millennium, and long-term solar cyclicity. Part 2. Experimental data analysisDergachev and Raspopov, 2010 Geomagnetism and Aeronomy 50, 393-402The effect of the natural factors (solar activity) on the long-term variations of global temperatures has been analyzed based on studying the borehole thermal regime in a time interval of 1000 years ago. It has been indicated that the temperatures started rising about 500 rather than 150 years ago as adherents of the anthropogenic impact on climate consider. The temperature maximum, the amplitude of which is larger than the present-day rise of temperature, is determined about 1000 years ago. The appearance of this maximum corresponds to the time interval of a long-term increase in solar activity according to the data of the 14C and 10Be cosmogenic isotopes. The stabilization of the global temperature in the last decades at a constant increase in the amount of greenhouse gases in the atmosphere contradicts the concept, according to which an increase in the global temperature in the last decades is only explained by the anthropogenic impact. Size of the coming solar cycle 24 based on Ohl's Precursor Method, final estimateKane, 2010 Annales Geophysicae 28, 1463-1466In Ohl's Precursor Method (Ohl, 1966, 1976), the geomagnetic activity during the declining phase of a sunspot cycle is shown to be well correlated with the size (maximum sunspot number Rz(max)) of the next cycle. For solar cycle 24, Kane (2007a) used aa(min)=15.5 (12-month running mean), which occurred during March-May of 2006 and made a preliminary estimate Rz(max)=124±26 (12-month running mean). However, in the next few months, the aa index first increased and then decreased to a new low value of 14.8 in July 2007. With this new low value, the prediction was Rz(max)=117±26 (12-month running mean). However, even this proved a false signal. Since then, the aa values have decreased considerably and the last 12-monthly value is 8.7, centered at May 2009. For solar cycle 24, using aa(min)=8.7, the latest prediction is, Rz(max)=58.0±25.0. Empirical evidence for a celestial origin of the climate oscillations and its implicationsScafetta, 2010 Journal of Atmospheric and Solar-Terrestrial Physics 72, 951-970We investigate whether or not the decadal and multi-decadal climate oscillations have an astronomical origin. Several global surface temperature records since 1850 and records deduced from the orbits of the planets present very similar power spectra. Eleven frequencies with period between 5 and 100 years closely correspond in the two records. Among them, large climate oscillations with peak-to-trough amplitude of about 0.1 and 0.25°C, and periods of about 20 and 60 years, respectively, are synchronized to the orbital periods of Jupiter and Saturn. Schwabe and Hale solar cycles are also visible in the temperature records. A 9.1-year cycle is synchronized to the Moon's orbital cycles. A phenomenological model based on these astronomical cycles can be used to well reconstruct the temperature oscillations since 1850 and to make partial forecasts for the 21st century. It is found that at least 60% of the global warming observed since 1970 has been induced by the combined effect of the above natural climate oscillations. The partial forecast indicates that climate may stabilize or cool until 2030-2040. Possible physical mechanisms are qualitatively discussed with an emphasis on the phenomenon of collective synchronization of coupled oscillators. Quantifying and specifying the solar influence on terrestrial surface temperaturede Jager et al. 2010 Journal of Atmospheric and Solar-Terrestrial Physics 72, 926-937This investigation is a follow-up of a paper in which we showed that both major magnetic components of the solar dynamo, viz. the toroidal and the poloidal ones, are correlated with average terrestrial surface temperatures. Here, we quantify, improve and specify that result and search for their causes. We studied seven recent temperature files. They were smoothed in order to eliminate the Schwabe-type (11 years) variations. While the total temperature gradient over the period of investigation (1610-1970) is 0.087 °C/century; a gradient of 0.077 °C/century is correlated with the equatorial (toroidal) magnetic field component. Half of it is explained by the increase of the Total Solar Irradiance over the period of investigation, while the other half is due to feedback by evaporated water vapour. A yet unexplained gradient of -0.040 °C/century is correlated with the polar (poloidal) magnetic field. The residual temperature increase over that period, not correlated with solar variability, is 0.051 °C/century. It is ascribed to climatologic forcings and internal modes of variation. We used these results to study present terrestrial surface warming. By subtracting the above-mentioned components from the observed temperatures we found a residual excess of 0.31° in 1999, this being the triangularly weighted residual over the period 1990-2008. We show that solar forcing of the ground temperature associated with significant feedback is a regularly occurring feature, by describing some well observed events during the Holocene. Introduction to special section on Climate and Weather of the Sun Earth SystemLübken et al. 2010 JGR-AtmospheresIn the special section on CAWSES (Climate and Weather of the Sun Earth System) a total of 19 papers are published covering several aspects of Sun-Earth coupling. Six papers concentrate on summer mesospheric ice clouds including detection by satellites, radar-based derivation of particle properties, and water vapor observations in the mesosphere. Solar radiation affects ice clouds on time scales of the 11 year solar cycle and 27 days. Stratospheric shrinking contributes significantly to long-term trends of ice clouds. The seasonal variability of smoke particles is confirmed to be impacted by global circulation. Six papers address the external forcing of the atmosphere caused by the Sun. The relevance of radionuclei and solar radiation spectral irradiance is presented. The impact of precipitating energetic solar particles on trace gas concentrations is studied. Ion chemistry and electron production can be important to destroy ozone in the mesosphere and upper stratosphere. Strong solar events can reduce ice clouds on short time scales owing to dynamical feed back mechanisms. The 27 day solar signal is identified in ozone concentration using satellite measurements. Model studies show that the dynamical response of the stratospheric polar vortex to solar cycle forcing depends on the phase of the quasi-biennial oscillation. The year 2009 was a remarkable exception from this rule reinforcing natural variability. Regarding centennial time scales it is shown that changes in the stratosphere can influence tropospheric circulation. Tides have extensively been studied within CAWSES. As is demonstrated, nonmigrating tides originating in the troposphere can propagate into the thermosphere. Strong signature of the active Sun in 100 years of terrestrial insolation dataWeber, 2010 Annalen der Physik 522, 372-381Terrestrial solar irradiance data of the Smithsonian Astrophysical Observatory from 1905 to 1954 and of Mauna Loa Observatory from 1958 to 2008 are analyzed. The analysis shows that, with changing solar activity, the atmosphere modifies the solar irradiance on the percentage level, in all likelihood via cosmic ray intensity variations produced by the active sun. The analysis strongly suggests that cosmic rays cause a large part of the atmospheric aerosols. These aerosols show specific absorption and scattering properties due to an inner structure of hydrated ionic centers, most probably of O2- and O2+ produced by the cosmic rays. How unprecedented a solar minimum?Rusell et al. 2010 REVIEWS OF GEOPHYSICS 48, RG2004The end of the current solar minimum is at least 2 years late, and indicators of solar and geomagnetic activity are approaching or are at their historical lows. We examine current indicators to determine how unprecedented this solar cycle might be, comment on possible earlier analogs to the current situation, and discuss attempts to predict future sunspot maxima on the basis of geomagnetic and solar magnetic data. Accompanying the change in the solar magnetic field has been a significant, albeit small, change in the total solar irradiance. Thus, the coming solar cycle(s) may provide an opportunity to separate the climatic effects of solar and anthropogenic sources. Evidence of solar and tropical-ocean forcing of hydroclimate cycles in southeastern Australia for the past 6500 yearsMcGowan et al. 2010 Geophysical Research Letters 37, L10705Evidence of solar and tropical-ocean forcing of climate cycles has been found in numerous palaeoclimate records. Numerical modelling studies show physical mechanisms by which direct and indirect solar forcing may affect climate, while there is mounting evidence of solar forcing of tropical ocean-atmosphere teleconnections. This study has developed a 6500 year record of dust deposition, a proxy for regional hydroclimate variability for the Snowy Mountains region of Australia. Spectral analysis of the record provides evidence of statistically significant cycles in dust deposition of 35-43 years, 62-73 years, 161 years and 2200 years. These correlate with variability in solar irradiance and the Pacific Decadal Oscillation (PDO). We present evidence to support physical links between variability in solar irradiance and change in the hydroclimate of southeast Australia and suggest that the effects of global warming and solar maxima on atmospheric circulation over extra-tropical regions may exacerbate these impacts. What's wrong with the sun?Clark, 2010 New Scientist 2764, 30-35Right now our nearest star should be flaring up as never before. But instead it's eerily calm - and we need to find out why. The Forthcoming Grand Minimum of Solar ActivityDuhau and de Jager, 2010 Journal of Cosmology 8, 1983-1999We summarize recent findings about periodicities in the solar tachocline and their physical interpretation. These lead us to conclude that solar variability is presently entering into a long Grand Minimum, this being an episode of very low solar activity, not shorter than a century. A consequence is an improvement of our earlier forecast of the strength at maximum of the present Schwabe cycle (#24). The maximum will be late (2013.5), with a sunspot number as low as 55. Late-twentieth-century warming in Lake Tanganyika unprecedented since AD 500Tierney et al. 2010 Nature GeoscienceInstrumental observations suggest that Lake Tanganyika, the largest rift lake in East Africa, has become warmer, increasingly stratified and less productive over the past 90 years. These trends have been attributed to anthropogenic climate change. However, it remains unclear whether the decrease in productivity is linked to the temperature rise, and whether the twentieth-century trends are anomalous within the context of longer-term variability. Here, we use the TEX86 temperature proxy, the weight per cent of biogenic silica and charcoal abundance from Lake Tanganyika sediment cores to reconstruct lake-surface temperature, productivity and regional wildfire frequency, respectively, for the past 1,500 years. We detect a negative correlation between lake-surface temperature and primary productivity, and our estimates of fire frequency, and hence humidity, preclude decreased nutrient input through runoff as a cause for observed periods of low productivity. We suggest that, throughout the past 1,500 years, rising lake-surface temperatures increased the stratification of the lake water column, preventing nutrient recharge from below and limiting primary productivity. Our records indicate that changes in the temperature of Lake Tanganyika in the past few decades exceed previous natural variability. We conclude that these unprecedented temperatures and a corresponding decrease in productivity can be attributed to anthropogenic global warming, with potentially important implications for the Lake Tanganyika fishery. Do climate models reproduce observed solar dimming and brightening over China and Japan?Swyer et al. 2010 JOURNAL OF GEOPHYSICAL RESEARCH, VOL. 115, D00K08, 8 PP.Previous research indicates that clear-sky downward solar radiation measured at the surface over China significantly decreased by about -8.6 W m-2 per decade during 1961-1989 and insignificantly increased during 1990-1999. Furthermore, solar radiation over Japan remained relatively constant during 1971-1989 and significantly increased by +5.3 W m-2 per decade during 1990-1999. The present study compares observed trends with those from twentieth century simulations by 14 global climate models in the CMIP3/IPCC-AR4. Since radiative forcing by aerosols is the primary contributor to long-term variations in surface solar radiation, the simulations are expected to resemble the observed trends if the input aerosol histories are realistic. To minimize the confounding impact of different cloud realizations in the observations and models, the radiative effects of cloud cover anomalies are removed from the surface solar radiation anomalies via linear regression. Although all of the models exhibit significant dimming trends over China before 1990, the largest model trend is -3.4 W m-2 per decade, less than half the magnitude and significantly different from the observed trend. Models including black carbon aerosol produce stronger decreasing trends than those that do not. The models also fail to reproduce the trend during 1990-1999 over Japan, and the largest model trend is +2.3 W m-2 per decade, only about half of the observed trend. These results suggest that global climate models uniformly underestimate the increase in aerosol radiative forcing over China prior to 1990 and uniformly underestimate the decrease in aerosol radiative forcing over Japan after 1990. Solar cycle signals in sea level pressure and sea surface temperatureRoy and Haigh 2010 Atmos. Chem. Phys., 10, 3147-3153We identify solar cycle signals in 155 years of global sea level pressure (SLP) and sea surface temperature (SST) data using a multiple linear regression approach. In SLP we find in the North Pacific a statistically significant weakening of the Aleutian Low and a northward shift of the Hawaiian High in response to higher solar activity, confirming the results of previous authors using different techniques. We also find a weak but broad reduction in pressure across the equatorial Pacific. In SST we identify a weak El Niño-like pattern in the tropics for the 155 year period, unlike the strong La Niña-like signal found recently by some other authors. We show that the latter have been influenced by the technique of compositing data from peak years of the sunspot cycle because these years have often coincided with the negative phase of the ENSO cycle. Furthermore, the date of peak annual sunspot number (SSN) generally falls a year or more in advance of the broader maximum of the 11-year solar cycle so that analyses which incorporate data from all years represent more coherently the difference between periods of high and low solar activity on these timescales. We also find that studies of the solar signal in SST over the second half of the 20th century may alias as ENSO signal if this is not properly taken into account. On misleading solar-climate relationshipLegras et al. 2010 Clim. Past Discuss., 6, 767-800A key issue of climate change is to identify the forcings and their relative contributions. Solar-climate relationship is currently the matter of a fierce debate. We address here the need for high quality observations and adequate statistical approach. A recent work by Le Mouel et al. (2010) and its companion paper by Kossobokov et al. (2010) show spectacular correlations between solar activity and meteorological parameters. We question both the data and the method used in these works. We stress 1) that correlation with solar forcing alone is meaningless unless other forcings are properly accounted and that sunspot counting is a poor indicator of solar irradiance, 2) that long series of temperature require homogenization to remove historical artefacts that affect long term variability, 3) that incorrect application of statistical tests leads to interpret as significant a signal which arises from pure random fluctuations. As a consequence, we reject the results and the conclusions of Le Mouel et al. (2010) and Kossobokov et al. (2010). We believe that our contribution bears some general interest in removing confusion from the scientific debate. Statistical issues about solar-climate relationsYiou et al. 2010 Clim. Past Discuss., 6, 767-800Assessing the relationship between temperature variations and solar activity requires much physical and statistical insight. This paper is devoted to the latter. We focus on the statistical significance of diagnostics to obtain properties of the variability of time series. We illustrate our study by analyses of European temperature datasets and geomagnetic field variations. The goal of the paper is to provide a framework to control the spurious results that statistical tools can generate. We show that some variability diagnostics barely distinguish observed temperatures from auto-regressive random processes. In general, the variability diagnostics between temperature and geomagnetic activity are not significantly correlated, due to a low number of degrees of freedom. Evolution of the solar magnetic flux on time scales of years to millenniaVieira and Solanki 2010 Astronomy and Astrophysics 509, A100Aims. We improve the description of the evolution of the Sun's open and total magnetic flux on time scales of years to millenia. Solar cycle signal in a general circulation and chemistry model with internally generated quasi-biennial oscillationSchmidt et al. 2010 JOURNAL OF GEOPHYSICAL RESEARCH, VOL. 115, D00I14, 16 PP.Simulations with the HAMMONIA general circulation and chemistry model are analyzed to improve the understanding of the atmospheric response to solar cycle variations and the role of the quasi-biennial oscillation of equatorial winds (QBO) for this response. The focus is on the Northern Hemisphere winter stratosphere. Owing to the internally produced QBO, albeit with a too short period of 24 months, the model is particularly suited for such an exercise. The simulation setup with only solar and QBO forcing allows an unambiguous attribution of the simulated signals. Two separate simulations have been performed for perpetual solar maximum and minimum conditions. The simulations confirm the plausibility of dynamical mechanisms, suggested earlier, that propagate the solar signal from the stratopause region downward to the troposphere. One feature involved in this propagation is a response maximum of temperature and ozone in the lower equatorial stratosphere. In our model, this maximum appears as a pure solar signal independent of the QBO and of other forcings. As observed, the simulated response of the stratospheric polar vortex to solar cycle forcing depends on the QBO phase. However, in the model this is statistically significant only in late winter. The simulation for early and mid winter suffers probably from a too strong internal variability of the polar vortex in early winter. Are cold winters in Europe associated with low solar activity?Lockwood et al. 2010 Environmental Research Letters 5(2)Solar activity during the current sunspot minimum has fallen to levels unknown since the start of the 20th century. The Maunder minimum (about 1650-1700) was a prolonged episode of low solar activity which coincided with more severe winters in the United Kingdom and continental Europe. Motivated by recent relatively cold winters in the UK, we investigate the possible connection with solar activity. We identify regionally anomalous cold winters by detrending the Central England temperature (CET) record using reconstructions of the northern hemisphere mean temperature. We show that cold winter excursions from the hemispheric trend occur more commonly in the UK during low solar activity, consistent with the solar influence on the occurrence of persistent blocking events in the eastern Atlantic. We stress that this is a regional and seasonal effect relating to European winters and not a global effect. Average solar activity has declined rapidly since 1985 and cosmogenic isotopes suggest an 8% chance of a return to Maunder minimum conditions within the next 50 years (Lockwood 2010 Proc. R. Soc. A 466 303-29): the results presented here indicate that, despite hemispheric warming, the UK and Europe could experience more cold winters than during recent decades. Solar activity and the mean global temperatureErlykin et al. 2009 Environ. Res. Lett., 4, 014006The variation with time from 1956 to 2002 of the globally averaged rate of ionization produced by cosmic rays in the atmosphere is deduced and shown to have a cyclic component of period roughly twice the 11 year solar cycle period. Long term variations in the global average surface temperature as a function of time since 1956 are found to have a similar cyclic component. The cyclic variations are also observed in the solar irradiance and in the mean daily sun spot number. The cyclic variation in the cosmic ray rate is observed to be delayed by 2-4 years relative to the temperature, the solar irradiance and daily sun spot variations suggesting that the origin of the correlation is more likely to be direct solar activity than cosmic rays. Assuming that the correlation is caused by such solar activity, we deduce that the maximum recent increase in the mean surface temperature of the Earth which can be ascribed to this activity is c. <4% of the observed global warming. Testing the proposed causal link between cosmic rays and cloud coverSloan and Wolfendale 2008 Environ. Res. Lett., 3, 024001A decrease in the globally averaged low level cloud cover, deduced from the ISCCP infrared data, as the cosmic ray intensity decreased during the solar cycle 22 was observed by two groups. The groups went on to hypothesize that the decrease in ionization due to cosmic rays causes the decrease in cloud cover, thereby explaining a large part of the currently observed global warming. We have examined this hypothesis to look for evidence to corroborate it. None has been found and so our conclusions are to doubt it. From the absence of corroborative evidence, we estimate that less than 23%, at the 95% confidence level, of the 11 year cycle change in the globally averaged cloud cover observed in solar cycle 22 is due to the change in the rate of ionization from the solar modulation of cosmic rays. A 4500-year proxy climate record from peatlands in the North of Ireland: the identification of widespread summer 'drought phases'?Swindles et al. in press Quaternary Science ReviewsMid-to-late Holocene high-resolution testate amoebae-derived water table reconstructions from two peatlands in the North of Ireland are presented. The proxy climate records are dated and correlated using a combination of AMS 14C dating, spheroidal carbonaceous particles and tephrochronology. The reconstructions start prior to the Hekla 4 tephra isochron (2395-2279 BC) and thus span the last w4500 years. The records are compiled by the process of tuning within chronological errors, standardisation and stacking. Comparisons are made to existing palaeoclimate records from peatlands in Northern Britain and Ireland and the compiled lake-level record for mid-latitude Europe. Four coherent dry phases are identified in the records at ca 1150-800 BC, 320 BC-AD 150, AD 250-470 and AD 1850-2000. Recent research has shown that peat-derived water table reconstructions reflect summer water deficit and therefore the dry phases are interpreted as periods with a higher frequency and/or greater magnitudes of summer drought. These 'drought phases' occur during periods of relatively low 14C production, which may add support to the hypothesis of persistent solar forcing of climate change during the Holocene. Any relationship with the North Atlantic stacked drift ice record is less clear. Temperature responses to spectral solar variability on decadal time scalesCahalan et al. 2010 GEOPHYSICAL RESEARCH LETTERS, VOL. 37, L07705Two scenarios of spectral solar forcing, namely Spectral Irradiance Monitor (SIM)-based out-of-phase variations and conventional in-phase variations, are input to a time-dependent radiative-convective model (RCM), and to the GISS modelE. Both scenarios and models give maximum temperature responses in the upper stratosphere, decreasing to the surface. Upper stratospheric peak-to-peak responses to out-of-phase forcing are c. 0.6 K and c. 0.9 K in RCM and modelE, c. 5 times larger than responses to in-phase forcing. Stratospheric responses are in-phase with TSI and UV variations, and resemble HALOE observed 11-year temperature variations. For in-phase forcing, ocean mixed layer response lags surface air response by c. 2 years, and is c. 0.06 K compared to c. 0.14 K for atmosphere. For out-of-phase forcing, lags are similar, but surface responses are significantly smaller. For both scenarios, modelE surface responses are less than 0.1 K in the tropics, and display similar patterns over oceanic regions, but complex responses over land. Trends in solar spectral irradiance variability in the visible and infraredHarder et al., 2009 GEOPHYSICAL RESEARCH LETTERS, VOL. 36, L07801[1] The Spectral Irradiance Monitor (SIM) on-board the Solar Radiation and Climate Experiment (SORCE) satellite provides the first multi-year continuous measurements of solar spectral irradiance (SSI) variability from 200-2400 nm, accounting for about 97% of the total solar irradiance (TSI). In addition to irradiance modulation from active region passage, the SSI values for wavelengths with a brightness temperature greater than 5770 K show a brightening with decreasing solar activity, whereas those with lower brightness temperatures show a dimming. These results demonstrate that different parts of the solar atmosphere contribute differently to the TSI with the behavior in the deep photospheric layers giving an opposing and nearly compensating trend to that in the upper photospheric and lower chromospheric layers. These findings need to be incorporated into Earth-climate assessments since the solar forcing induced by these differential trends are inherently different from the relatively flat spectral contributions employed in the IPCC assessments. Cosmic rays and global warmingErlykin et al. 2010 Europhysics News 41(1)(no abstract) 27-day variation in cloud amount in the Western Pacific warm pool region and relationship to the solar cycleTakahashi et al. 2010 Atmos. Chem. Phys., 10, 1577-1584Although linkages between solar activity and the earth's climate have been suggested and the 11-year cycle in solar activity evident in sunspot numbers is the most examined example of periodicity in previous studies, no quantitative evidence indicating a relationship for tropospheric phenomena has been found for a short period. Based on FFT analysis for OLR (Outgoing Longwave Radiation) compared with the F10.7 index, we clearly demonstrate a 27-day variation in the cloud amount in the region of the Western Pacific warm pool, which is only seen in the maximum years of 11-year solar activity. The average spectrum in such years also shows an enhancement in the range of the MJO (Madden-Julian Oscillation) period. Although there exist some explanations for possible mechanisms, the exact cause is unknown. Therefore, the proposed connection between 27-day cloud variation and solar cycle in the WPWP region is still a hypothesis and various kinds of varification based on other meteorological and solar parameters are strongly required. Results from the CERN pilot CLOUD experimentDuplissy et al. 2010 Atmos. Chem. Phys., 10, 1635-1647During a 4-week run in October-November 2006, a pilot experiment was performed at the CERN Proton Synchrotron in preparation for the Cosmics Leaving OUtdoor Droplets (CLOUD) experiment, whose aim is to study the possible influence of cosmic rays on clouds. The purpose of the pilot experiment was firstly to carry out exploratory measurements of the effect of ionising particle radiation on aerosol formation from trace H2SO4 vapour and secondly to provide technical input for the CLOUD design. A total of 44 nucleation bursts were produced and recorded, with formation rates of particles above the 3 nm detection threshold of between 0.1 and 100 cm-3s-1, and growth rates between 2 and 37 nm h-1. The corresponding H2O concentrations were typically around 106 cm-3 or less. The experimentally-measured formation rates and \htwosofour concentrations are comparable to those found in the atmosphere, supporting the idea that sulphuric acid is involved in the nucleation of atmospheric aerosols. However, sulphuric acid alone is not able to explain the observed rapid growth rates, which suggests the presence of additional trace vapours in the aerosol chamber, whose identity is unknown. By analysing the charged fraction, a few of the aerosol bursts appear to have a contribution from ion-induced nucleation and ion-ion recombination to form neutral clusters. Some indications were also found for the accelerator beam timing and intensity to influence the aerosol particle formation rate at the highest experimental SO2 concentrations of 6 ppb, although none was found at lower concentrations. Overall, the exploratory measurements provide suggestive evidence for ion-induced nucleation or ion-ion recombination as sources of aerosol particles. However in order to quantify the conditions under which ion processes become significant, improvements are needed in controlling the experimental variables and in the reproducibility of the experiments. Finally, concerning technical aspects, the most important lessons for the CLOUD design include the stringent requirement of internal cleanliness of the aerosol chamber, as well as maintenance of extremely stable temperatures (variations below 0.1°C) Atmospheric data over a solar cycle: no connection between galactic cosmic rays and new particle formationKulmala et al. 2010 Atmos. Chem. Phys., 10, 1885-1898Aerosol particles affect the Earth's radiative balance by directly scattering and absorbing solar radiation and, indirectly, through their activation into cloud droplets. Both effects are known with considerable uncertainty only, and translate into even bigger uncertainties in future climate predictions. More than a decade ago, variations in galactic cosmic rays were suggested to closely correlate with variations in atmospheric cloud cover and therefore constitute a driving force behind aerosol-cloud-climate interactions. Later, the enhancement of atmospheric aerosol particle formation by ions generated from cosmic rays was proposed as a physical mechanism explaining this correlation. Here, we report unique observations on atmospheric aerosol formation based on measurements at the SMEAR II station, Finland, over a solar cycle (years 1996-2008) that shed new light on these presumed relationships. Our analysis shows that none of the quantities related to aerosol formation correlates with the cosmic ray-induced ionisation intensity (CRII). We also examined the contribution of ions to new particle formation on the basis of novel ground-based and airborne observations. A consistent result is that ion-induced formation contributes typically significantly less than 10% to the number of new particles, which would explain the missing correlation between CRII and aerosol formation. Our main conclusion is that galactic cosmic rays appear to play a minor role for atmospheric aerosol formation events, and so for the connected aerosol-climate effects as well. Cosmic rays, climate and the origin of lifeErlykin et al., 2010 CERN Courier 50(2), p. 15-17Does ionization of the atmosphere produced by cosmic rays influence cloud cover? Analysis as a function of geomagnetic latitude suggests not. However, it is possible that cosmic rays may have a role in lightning, and perhaps even in the origin of life on Earth. On the effect of a new grand minimum of solar activity on the future climate on EarthFeulner and Rahmstorf, 2010 GEOPHYSICAL RESEARCH LETTERS, VOL. 37, L05707The current exceptionally long minimum of solar activity has led to the suggestion that the Sun might experience a new grand minimum in the next decades, a prolonged period of low activity similar to the Maunder minimum in the late 17th century. The Maunder minimum is connected to the Little Ice Age, a time of markedly lower temperatures, in particular in the Northern hemisphere. Here we use a coupled climate model to explore the effect of a 21st-century grand minimum on future global temperatures, finding a moderate temperature offset of no more than -0.3°C in the year 2100 relative to a scenario with solar activity similar to recent decades. This temperature decrease is much smaller than the warming expected from anthropogenic greenhouse gas emissions by the end of the century. The Solar CycleHathaway, 2010 Living Reviews in Solar PhysicsThe Solar Cycle is reviewed. The 11-year cycle of solar activity is characterized by the rise and fall in the numbers and surface area of sunspots. We examine a number of other solar activity indicators including the 10.7 cm radio flux, the total solar irradiance, the magnetic field, flares and coronal mass ejections, geomagnetic activity, galactic cosmic ray fluxes, and radioisotopes in tree rings and ice cores that vary in association with the sunspots. We examine the characteristics of individual solar cycles including their maxima and minima, cycle periods and amplitudes, cycle shape, and the nature of active latitudes, hemispheres, and longitudes. We examine long-term variability including the Maunder Minimum, the Gleissberg Cycle, and the Gnevyshev-Ohl Rule. Short-term variability includes the 154-day periodicity, quasi-biennial variations, and double peaked maxima. We conclude with an examination of prediction techniques for the solar cycle. A History of Solar Activity over MillenniaUsoskin, 2008/2010 Living Reviews in Solar PhysicsPresented here is a review of present knowledge of the long-term behavior of solar activity on a multi-millennial timescale, as reconstructed using the indirect proxy method. The concept of solar activity is discussed along with an overview of the special indices used to quantify different aspects of variable solar activity, with special emphasis upon sunspot number. Over long timescales, quantitative information about past solar activity can only be obtained using a method based upon indirect proxy, such as the cosmogenic isotopes 14C and 10Be in natural stratified archives (e.g., tree rings or ice cores). We give an historical overview of the development of the proxy-based method for past solar-activity reconstruction over millennia, as well as a description of the modern state. Special attention is paid to the verification and cross-calibration of reconstructions. It is argued that this method of cosmogenic isotopes makes a solid basis for studies of solar variability in the past on a long timescale (centuries to millennia) during the Holocene. A separate section is devoted to reconstructions of strong solar-energetic-particle (SEP) events in the past, that suggest that the present-day average SEP flux is broadly consistent with estimates on longer timescales, and that the occurrence of extra-strong events is unlikely. Finally, the main features of the long-term evolution of solar magnetic activity, including the statistics of grand minima and maxima occurrence, are summarized and their possible implications, especially for solar/stellar dynamo theory, are discussed. Sudden cosmic ray decreases: No change of global cloud coverCalogovic et al. 2010 GEOPHYSICAL RESEARCH LETTERS, VOL. 37, L03802Currently a cosmic ray cloud connection (CRC) hypothesis is subject of an intense controversial debate. It postulates that galactic cosmic rays (GCR) intruding the Earth's atmosphere influence cloud cover. If correct it would have important consequences for our understanding of climate driving processes. Here we report on an alternative and stringent test of the CRC-hypothesis by searching for a possible influence of sudden GCR decreases (so-called Forbush decreases) on clouds. We find no response of global cloud cover to Forbush decreases at any altitude and latitude. Solar arctic-mediated climate variation on multidecadal to centennial timescales: Empirical evidence, mechanistic explanation, and testable consequencesSoon 2009 Physical Geography, 30, 2, pp. 144-184Soon (2005) showed that the variable total solar irradiance (TSI) could explain, rather surprisingly, well over 75% of the variance for the decadally smoothed Arctic-wide surface air temperature over the past 130 years. The present paper provides additional empirical evidence for this physical connection, both through several newly published high-resolution paleo-proxy records and through robust climate-process modeling outputs. This paper proposes a mechanistic explanation, involving: (1) the variable strength of the Atlantic meridional overturning circulation (MOC) or thermohaline circulation (THC); (2) the shift and modulation of the Inter-Tropical Convergence Zone (ITCZ) rainbelt and tropical Atlantic ocean conditions; and (3) the intensity of the wind-driven subtropical and subpolar gyre circulation, across both the North Atlantic and North Pacific. A unique test of this proposed solar TSI-Arctic thermal-salinity-cryospheric coupling mechanism is the 5- to 20-year delay effect on the peak Atlantic MOC flow rate centered near 30-35°N, and on sea surface temperature (SST) for the tropical Atlantic. The solar Arctic-mediated climate mechanism on multidecadal to centennial timescales presented here can be compared with and differentiated from both the related solar TSI and UV irradiance forcing on decadal timescales. The ultimate goal of this research is to gain sufficient mechanistic details so that the proposed solar-Arctic climate connection on multidecadal to centennial timescales can be confirmed or falsified. A further incentive is to expand this physical connection to longer, millennial-scale variability as motivated by the multiscale climate interactions shown by Braun et al. (2005), Weng (2005), and Dima and Lohmann (2009). Meridional transport and deposition of atmospheric 10BeHeikkilä et al. 2009 Atmos. Chem. Phys., 9, 515-52710 Be concentrations measured in ice cores exhibit larger temporal variability than expected based on theoretical production calculations. To investigate whether this is due to atmospheric transport a general circulation model study is performed with the 10 Be production divided into stratospheric, tropospheric tropical, tropospheric subtropical and tropospheric polar sources. A control run with present day 10 Be production rate is compared with a run during a geomagnetic minimum. The present 10 Be production rate is 4-5 times higher at high latitudes than in the tropics whereas during a period of no geomagnetic dipole field it is constant at all latitudes. The 10 Be deposition fluxes, however, show a very similar latitudinal distribution in both the present day and the geomagnetic minimum run indicating that 10 Be is well mixed in the atmosphere before its deposition. This is also confirmed by the fact that the contribution of 10 Be produced in the stratosphere is dominant (55%-70%) and relatively constant at all latitudes. The contribution of stratospheric 10 Be is approximately 70% in Greenland and 60% in Antarctica reflecting the weaker stratosphere-troposphere air exchange in the Southern Hemisphere. Total solar irradiance during the HoloceneSteinhilber et al. 2009 GEOPHYSICAL RESEARCH LETTERS, VOL. 36, L19704For the first time a record of total solar irradiance covering 9300 years is presented, which covers almost the entire Holocene. This reconstruction is based on a recently observationally derived relationship between total solar irradiance and the open solar magnetic field. Here we show that the open solar magnetic field can be obtained from the cosmogenic radionuclide 10Be measured in ice cores. Thus, 10Be allows to reconstruct total solar irradiance much further back than the existing record of the sunspot number which is usually used to reconstruct total solar irradiance. The resulting increase in solar-cycle averaged TSI from the Maunder Minimum to the present amounts to (0.9 ± 0.4) Wm2. In combination with climate models, our reconstruction offers the possibility to test the claimed links between climate and TSI forcing.
|

| EIT 171 | EIT 195 | EIT 284 | EIT 304 |
 |  |  |  |
| More 512×512 | More 512×512 | More 512×512 | More 512×512 |
| SDO/HMI Continuum | SDO/HMI Magnetogram | LASCO C2 | LASCO C3 |
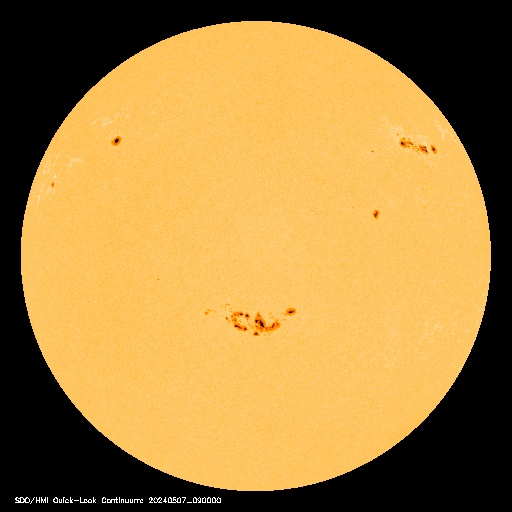 | 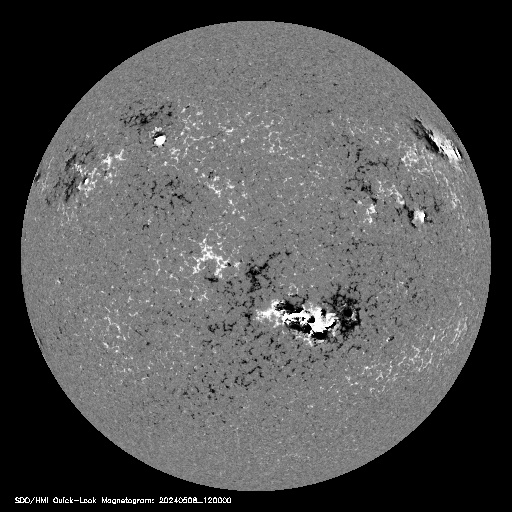 | 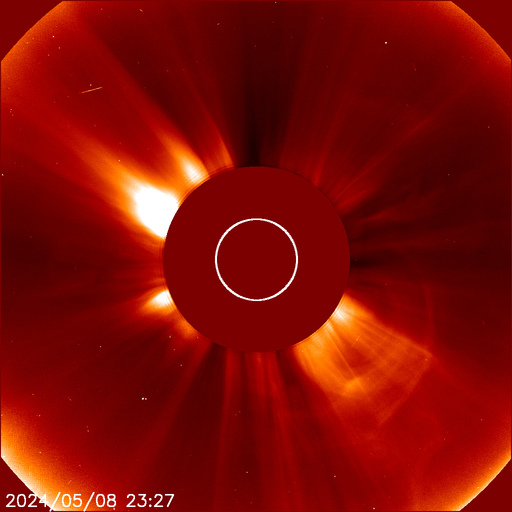 | 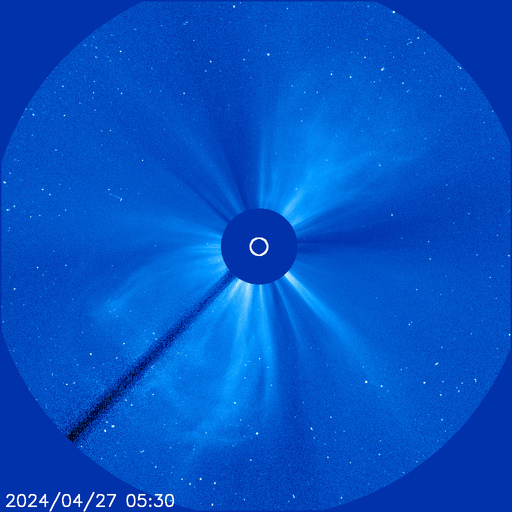 |
| More 512×512 | More 512×512 | More 512×512 | More 512×512 |
|
|
Kaldari veður og sjaldséð norðurljós? |
| Tilkynna um óviðeigandi tengingu við frétt | |
Heimspeki | Breytt s.d. kl. 08:30 | Slóð | Facebook | Athugasemdir (9)
Sunnudagur, 29. desember 2013
Almenn rökfræði, bók sem kom út fyrir 100 árum og tölvutæknin í dag...

Í ár eru liðin 100 ár síðan afi minn og nafni gaf út bókina Almenn rökfræði - Til notkunar við sjálfsnám og nám í forspjallsvísindum við Háskóla Íslands.
Rökfræðin er í dag undirstaða tölvutækninnar og margt furðu líkt með þessari gömlu bók og góðum kennslubókum í undirstöðuatriðum tölvutækninnar og forritun, og er ekki tilviljun að við smíði tölva eru svokallaðar rökrásir notaðar. Sömu eða hliðstæð hugtök að aðferðir koma fyrir. Margir kannast við Venn myndir (eða mengjafræði) og sannleikstöflur (e: truth tables). Hvort tveggja er notað í bókinni. Í þessum stutta pistli verður þessi skyldleiki skoðaður aðeins nánar ásamt því sem efni bókarinnar verður kynnt í stuttu máli með ljósritum úr bókinni. Að sjálfsögðu getur aðeins verið um örstutt ágrip að ræða því þessi 100 ára gamla bók er 125 blaðsíður að lengd.
Formáli höfundar hefst á þessum orðum: 
Inngangur bókarinnar:

Efni bókarinnar skiptist í þrjá hluta: Hugsunarfræði, Þekkingarfræði og Um rökskekkjur og rangar staðhæfingar, og hver hluti í nokkra kafla:

Í fyrsta hluta bókarinnar er fjallað um það sem höfundur nefnir Hugsunarfræði (logica formalis). Þar er fjallað fræðilega um aðferðir til að greina viðfangsefnið og draga réttar ályktanir. Í raun er þetta sama stærðfræði og aðferðafræði notuð er í fræðibókum um grunnatriði tölvutækninnar í dag, þó svo að framsetningin sé að hluta til frábrugðin, enda hugsar mannsheilinn ekki á sama hátt og tölvan. Þeir sem lært hafa dálítið í tölvutækni ættu að kannast við úrklippur úr þessari 100 ára gömlu bók, en það þarf auðvitað ekki að koma á óvart því ekki varð tölvutæknin allt í einu til úr engu. Hún byggir á traustum grunni sem lagður var á löngum tíma. Kaflar þessa hluta bókarinnar nefnast: Hugsunarlögmálin, Hugtök, Dómar og Rökleiðslur.
  Hér má sjá dæmi um aðferðafræði sem sumir kannast við úr tölvutækninni. ---
Í öðrum hluta bókarinnar er fjallað um Þekkingarfræðina (logica materialis). Þar stendur í byrjun: „Eins og tekið hefur verið fram á hugsunin, til þess að hún geti orðið að sannri þekkingu, ekki einungis til að vera rökrétt, heldur og raunrétt. Hugsunarfræðin hefur nú kennt oss, í hverju rökrétt hugsun er fólgin; en nú á þekkingarfræðin að kenna oss, á hvern hátt og að hve miklu leyti rökrétt hugsun getur orðið að raunréttri þekkingu...."

Enn og aftur kemur á óvart að hér eru notaðar sömu aðferðir og í tölvutækninni þegar vandamálin eru krufin til mergjar áður en tölvan er forrituð: 
Kaflar þessa hluta bókarinnar nefnast: Tilgangur og eðli þekkingarinnar, Stig þekkingarinnar, Hinar vísindalegu aðferðir og Takmörk þekkingarinnar.
---
Þriðji og síðasti hluti bókarinnar nefnist Um rökskekkjur og rangar staðhæfingar.

---
Aftast í bókinni er „Orðasafn yfir helstu fræðiorð og íslensk nýyrði, sem notuð eru í bók þessari, með tilvitnun í þær greinar, þar sem orðin koma fyrst fyrir". Þessi fræðiorð og nýyrði eru um 300 talsins.

Að lokum er hér fyrir neðan allur formáli bókarinnar klipptur saman af tveim síðum, en efst var aðeins hluti hans: --- --- ---
Ofangreint er úr frumútgáfu bókarinnar sem notuð var alllengi við kennslu í Háskóla Íslands. Bókin er ekki til sem rafbók, en úr því mætti gjarnan bæta. Vonandi hafa einhverjir haft nokkra ánægju af því að kynnast efni þessarar 100 ára gömlu bókar um rökfræði.
|


Ritstjórinn óskar lesendum pistilsins gleðilegs árs.
Heimspeki | Breytt s.d. kl. 12:35 | Slóð | Facebook | Athugasemdir (4)
Sunnudagur, 27. október 2013
Er hægt að ímynda sér nokkuð yndislegra en að vera utanhúss í kolsvarta myrkri...?

Að vera einn í miðpunkti alheimsins og horfa upp... Með góða handsjónaukanum blasir önnur vetrarbraut við, við nefnum hana Andrómedu. Þar eru milljarðar sólstjarna og vafalaust milljónir reikistjarna með lífi. Vafalítið er þar víða líf sem er miklu þróaðra en hér niðri, hugsa ég. Meðan enginn sér til vinka ég feimnislega upp til vina minna sem eru einhvers staðar í hinni þokukenndu, fögru og dularfullu Andromedu. Kannski vinka þeir niður til mín núna...? Hver veit? - Undir tindrandi stjörnunum í kolsvörtu myrkrinu vaknar barnssálin í mér. Ég yngist upp. Verð ekki samur aftur. Hef tengst eilífðinni... Hvað finnst þér? Hefur þú upplifað ómengaðan svartan tindrandi stjörnuhimin? Hefur þú séð Vetrarbrautina okkar? Hefur þú fallið í stafi af hrifningu? -
Myrkurgæði á Íslandi. Greinargerð starfshóps um myrkurgæði og ljósmengun ásamt tillögum um úrbætur og frekari athugun, International Dark-Sky Association. Alþjóðasamtök gegn ljósmengun, Hefur þú séð Andromedu...? Hægt er að sjá hana með handsjónauka þar sem ljósmengun er lítil, Ljósmengun í þéttbýli og dreifbýli... Auðlind sem er að hverfa, |

Stjörnur, landslag í tunglskini, norðurljós og smá ljósmengun frá gróðurhúsum
Heimspeki | Breytt s.d. kl. 12:15 | Slóð | Facebook | Athugasemdir (3)
Fimmtudagur, 22. desember 2011
Vetrarsólstöður í dag: Lengsta nótt ársins að baki...

Vetrarsólstöður eru í ár 22. desember. Sólin er í dag lægst á lofti, dagurinn stystur og nýliðin nótt sú lengsta á árinu. Á morgun fer sólin að hækka á lofti og dagurinn að lengjast, þó ekki muni nema hænufeti fyrst í stað. Áður en við vitum af fer vorilmur að finnast í lofti, fuglar að syngja, ástin blómstrar og vorið er komið! "Fyrsta sólarhring frá sólstöðum lengist sólargangurinn í Reykjavík um 9 sekúndur. Annan daginn lengist hann um 27 sekúndur og þriðja daginn um 44 sekúndur. Þetta eru sem sagt "hænufetin" í Reykjavík. Á Akureyri er fyrsta hænufetið 12 sekúndur, hið næsta 37 sekúndur og hið þriðja 62 sekúndur", stendur í grein eftir Þorstein Sæmundsson sem birtist í Almanaki Háskólans árið 1993. Greinina má lesa hér.
Myndin er tekin fyrir skömmu í uppsveitum Árnessýslu. |

Gleðileg Jól
Heimspeki | Breytt s.d. kl. 06:36 | Slóð | Facebook | Athugasemdir (4)
Laugardagur, 8. janúar 2011
Undarleg fylgni milli kolsýrunnar og hitastigs. Hvað er að gerast...?

Þessi merkilega mynd er á vef prófessors Ole Humlum við Oslóarháskóla.
Á myndinni má sjá sambandið milli hitastigs lofthjúpsins og styrks CO2 síðan reglubundnar mælingar á CO2 hófust 1958.
Eitthvað merkilegt er að gerast.
Ferillinn ætti að vera sívaxandi frá vinstri til hægri, en það er hann alls ekki. Á síðustu árum fellur hitastigið með vaxandi styrk koldíoxíðs, CO2. Reyndar sést sama fyrirbærið einnig í byrjun ferilsins, þ.e. á árunum eftir 1958 þegar styrkur CO2 var miklu lægri en í dag.
Hvað segir Prófessor Ole Humlum um þetta fyrirbæri? Sjá neðst á síðunni hér.
Diagram showing HadCRUT3 monthly global surface temperature estimate plotted against the monthly atmospheric CO2 content according to the Mauna Loa Observatory, Hawaii, back to March 1958. The red line is a polynomial fit with key statistics listed in the upper left part of the diagram. Last month incorporated in the analysis: October 2010 (inside red circle). Last diagram update: 22 December 2010.
The diagram above shows all HadCRUT3 monthly temperatures plotted against the monthly Mauna Loa CO2 values, since the initiation of these measurements in 1958. As the amount of atmospheric CO2 have risen steadily since 1958, although with annual variations, the oldest values of temperature and CO2 are plotted close to the left side of the diagram, and more recent values are progressively plotted towards the right side of the diagram.
By this, the diagram illustrates that the overall relation between atmospheric CO2 and global temperature apparently has changed several times since 1958.
In the early part of the period, with CO2 concentrations close to 315 ppm, an increase of CO2 was associated with decreasing global air temperatures. When the CO2 concentration around 1975 reached 325 ppm this association changed, and increasing atmospheric CO2 was now associated with rising global temperatures. However, when the CO2 concentration at the turn of the century reached about 378 ppm, the association changed back to that characterizing the period before 1975. Thus, since 2000, increasing concentration of atmospheric CO2 has again been associated with decreasing global temperature.
The diagram above thereby demonstrates that CO2 can not have been the dominant control on global temperatures since 1958. Had CO2 been the dominant control, periods of decreasing temperature (longer than 2-5 years) with increasing CO2 values should not occur. It might be argued (IPCC 2007) that the CO2 dominance first emerged around 1975, but if so, the recent breakdown of the association around 2000 should not occur, either.
Consequently, the complex nature of the relation between global temperature and atmospheric CO2 since at least 1958 therefore represents an example of empirical falsification of the hypothesis ascribing dominance on the global temperature by the amount of atmospheric CO2. Clearly, the potential influence of CO2 must be subordinate to one or several other phenomena influencing global temperature. Presumably, it is more correct to characterize CO2 as a contributing factor for global temperature changes, rather than a dominant factor.
The breakdown of the positive temperature-CO2 relation since about 2000 (diagram above) have now lasted 10-11 years. This suggests that the recent global temperature development might deviate significantly from previous short-lived (2-5 years) periods of cooling derived from oceanic and volcanic activity as seen several times between 1975 and 2000. There are two possibilities: 1) Global air temperatures may again begin to increase in a short while. 2) The recent development may represent the beginning of a more thorough and long-lasting cooling, perhaps similar to the cooling period after 1940. As usual, time will show what is correct.
Ekki vil ég reyna að bæta nokkru við þessi orð prófessorsins og ekki er við bloggarann að eiga ef einhverjum mislíkar hegðun náttúrunnar eða skrif Dr. Ole Humlum.
Hitamæligögn eru frá hinni virtu stofnun Climate Research Unit. CO2 gögn eru frá NOAA.
Sjá nánar síðuna Climate Reflections sem er einn kafli vefsíðunnar Climate4You.com
Á vef prófessors Ole Humlum er fjölmargt fróðlegt. M.a. er myndin sem er hér fyrir neðan þaðan.

Smella má tvisvar á myndir til að stækka
Um prófessor Ole Humlum
Smella hér til að sjá greinasafn prófessorsins
"Margt er skrýtið í kýrhausnum"
Heimspeki | Breytt 10.1.2011 kl. 18:22 | Slóð | Facebook | Athugasemdir (27)
Miðvikudagur, 25. ágúst 2010
Eldrauðar appelsínur...

Eru appelsínur eldrauðar?
Er eldurinn appelsínurauður eða appelsínugulur?
Er ekki eldurinn eldrauður?
Hvers vegna segjum við að eitthvað sé appelsínurautt, appelsínugult, rauðgult eða órans þegar til er orð sem nær yfir hugtakið, þ.e. eldrautt?
Hvers vegna notum við orðið eldrautt yfir hluti sem eru blóðrauðir?
Forfeður okkar vissu vel hvernig eldurinn er á litinn, en fæstir höfðu séð appelsínur. Í huga þeirra var eldurinn einfaldlega eldrauður. Eldrautt var litur hans.
Þeir gerðu greinarmun á eldrauðu og blóðrauðu, enda þekktu þeir liti elds og blóðs vel...

(Eða er hún appelsínugul eða appelsínurauð?)
Heimspeki | Breytt 23.11.2017 kl. 07:40 | Slóð | Facebook | Athugasemdir (5)
Laugardagur, 22. maí 2010
Mamma, af hverju er himinninn blár...?

Mamma, af hverju er himinninn blár? Þannig spurði Ari litli í hugljúfu kvæði Stefáns Jónssonar, Aravísur, en hvað prýðir góða vísindamenn? Hvers konar vísindamenn eru það sem ekki sætta sig við "samdóma álit vísindamanna" og halda áfram að spyrja spurninga? Þora að ganga á móti straumnum. Hvers vegna verða sumir brautryðjendur í sinni grein og bylta hinu samdóma áliti? Breyta heiminum, oft svo um munar.
Hvernig hugsa sannir vísindamenn? Þeir halda áfram að spyrja spurninga og leita svara. Þeir eru aldrei ánægðir með svörin, heldur alltaf haldnir ákveðnum efa. Kannski er það þess vegna sem sumir vilja kalla þá efasemdarmenn, en það er einmitt aðall sannra vísindamanna.
The important thing is not to stop questioning. Curiosity has its own reason for existing.
One cannot help but be in awe when he contemplates the mysteries of eternity, of life, of the marvelous structure of reality. It is enough if one tries merely to comprehend a little of this mystery every day. Never lose a holy curiosity. - Albert Einstein.
Hann Ari litli hefði örugglega orðið góður vísindamaður. Kannski varð hann einmitt slíkur, hver veit?
hann er átta ára trítill
með augu mjög falleg og skær.
Hann er bara sætur
jafnvel eins er hann grætur
og hugljúfur þegar hann hlær.
En spurningum Ara
er ei auðvelt að svara.
Mamma, af hverju er himinninn blár?
Sendir Guð okkur jólin?
Hve gömul er sólin?
Pabbi, hví hafa hundarnir hár?
Bæði pabba og mömmu
og afa og ömmu
þreytir endalaust spurninga suð.
Hvar er sólin um nætur?
Hví er sykurinn sætur?
Afi, gegndu, hver skapaði Guð?
Hvar er heimsendir, amma?
Hvað er eilífðin, mamma?
Pabbi, af hverju vex á þér skegg?
Hví er afi svo feitur?
Hví er eldurinn heitur?
Hví eiga ekki hanarnir egg?
Það þykknar í Ara
ef þau ekki svara
og þá verður hann ekki rór.
Svo heldur en þegja
þau svara og segja:
“Þú veist það er verðurðu stór”.
Fyrst hik er á svari
þá hugsar hann Ari
og hallar þá kannski undir flatt
og litla stund þegir,
að lokum hann segir:
“Þið eigið að segja mér satt”.
Víst er það, Ari hefur örugglega verið gott efni í vísindamann. Hann kunni nefnilega að spyrja spurninga og var óhræddur við að varpa þeim fram. Það er þó ekki alltaf vel liðið þegar fullorðnir vísindamenn spyrja óþægilegra spurninga eins og Einstein minnti okkur á:
Great spirits have always encountered violent opposition from mediocre minds. The mediocre mind is incapable of understanding the man who refuses to bow blindly to conventional prejudices and chooses instead to express his opinions courageously and honestly-
Ég óska ykkur góðrar Hvítasunnuhelgar, og fyrir alla muni svarið börnum ykkar og barnabörnum betur en fullorðna fólkið svaraði Ara litla forðum. Varðveitið einnig barnið í hjörtum ykkar sjálfra og hættið ekki að spyrja spurninga... Hættið ekki að efast.
Einstein, Bohr, Darwin, Pasteur, Freud, Galileo, Lavosier, Kepler, Copernicus, Faraday, Maxwell, Bernard, Boas, Heisenberg, Pauling, Schrödinger, Rutherford, Dirac, TycoBrahe, Boltzman, MarieCurie, Herchel, Laplace, Wegener, Euclid, Archimeds, ...
... ... ...
...
Heimspeki | Breytt s.d. kl. 12:28 | Slóð | Facebook | Athugasemdir (0)
Laugardagur, 13. febrúar 2010
Danskir vísindamenn uppgötva vísbendingar um uppruna vatns á jörðinni...

Það hlýtur að teljast meiriháttar afrek að finna vatn umhverfis unga stjörnu sem er í 815 ljósára fjarlægð frá jörðu, en það hafa danskir vísindamenn einmitt gert samkvæmt nýlegri grein í danska blaðinu Ingeniøren. Greinina má lesa hér á vefsíðu blaðsins.
Þessi uppgötvun getur hugsanlega hjálpað okkur að skilja uppruna vatnsins á jörðinni, en vatnið er undirstaða alls lífs.
Vísindamennirnir fundu mikið vatn umhverfis stjörnuna NGC1333-IRAS4B með litrófsmælingum. Til þess notuðu þeir sex stóra útvarpssjónauka sem eru við Grenoble í Frakklandi (sjá: Institut de Radioastronomie Millimétrique en þar er frétt im málið: Première localisation de l’eau dans un système planétaire en formation), en ekki venjulega sjónauka, þannig að það er ef til vill ekki alveg rétt að tala um litróf, en útvarpsbylgjur og ljós eru þó af sama meiði, þ.e. hvort tveggja rafsegulöldur.
Þetta er stjarna sem er að byrja að myndast úr geimryki. Umhverfis hana hefur fundist gríðarmikið magn af vatni sem vísindamennirnir hafa áætlað vera 100 sinnum meira en vatnið á jörðinni.
Hér má sjá hina ungu stjörnu NGC1333-IRAS4B. Efst til vinstri má sjá fingrafar vatns í "litrófinu" sem gulan topp ásamt merki frá lífrænum efnasamböndum sem bláa toppa. Neðst til vinstri má sjá hvar vatnið var að finna.
Myndin efst á síðunni sýnir hugmynd listamanns um hvernið þessi unga stjarna gæti litið út. Hugsanlega eiga reikistjörnur eftir að myndast í ryk-skífunni sem er umhverfis sólina.
Takk Albert Albertsson fyrir ábendinguna!
--- --- ---
Lesið alla greinina sem bloggarinn nappaði af vef Ingeniøren:
http://ing.dk/artikel/106239-dansk-opdagelse-giver-ny-viden-om-vands-tilblivelse-paa-jorden
Dansk opdagelse giver ny viden om vands tilblivelse på Jorden
Astronomer fra Danmark har fundet vanddamp omkring en stjerne, der blev til under sidste istid. Opdagelsen kan vise sig at være med til at løse gåden om, hvordan vand blev til på vores planet.
Af Thomas A. E. Andersen , onsdag 10. feb 2010 kl. 10:07
Fundet af vanddamp omkring en ung stjerne 815 lysår fra Jorden kan måske være med til at forklare, hvordan vandet, som er grundlag for liv som vi kender det i dag, er kommet til Jorden.
Det er en gruppe astronomer under ledelse af Jes Jørgensen fra Center for Stjerne og Planetdannelse ved Statens Naturhistoriske Museum i København og Bonn Universitet som har fundet store mængder vanddamp i den roterende gas- og støvskive omkring stjernen NGC1333-IRAS4B.
Stjernen befinder sig 815 lysår fra Jorden og kan være forløberen for et planetsystem som vores eget solsystem.
Mere end 100 gange vandet i alle verdenshave
Ved hjælp af seks store radio-teleskoper placeret ved Grenoble i Frankrig, søgte astronomerne efter vand omkring den unge stjerne.
Stjernen NGC1333-IRAS4B blev dannet for cirka 10,000-50,000 år siden - samtidig med den sidste istid her på Jorden. Resultatet af observationerne viste, at der er en stor mængde vanddamp omkring
denne unge stjerne – og det befinder sig inden for et område svarende til afstanden mellem Solen og den yderste planet i vores solsystem, Neptun.
Mængden af vand i skiven er langt større end hvad man tidligere har antaget - mere end 100 gange den samlede mængde vand i alle verdenshavene på Jorden. Ewine van Dishoeck fra Leiden Universitet i Holland, som er medforfatter på artiklen, siger i en pressemeddelse:
»På grund af de lave temperaturer i molekyleskyen er det meste af vandet blevet til is før stjernen er blevet dannet, men i skiven tæt på den unge stjerne fordamper alt vandet, så vi kan observere det med vores radioteleskoper.«
Kollapset molekylesky fik det til at regne
Vand er grundlaget for liv som vi kender det på Jorden. En stor del af vandet i havene på Jorden stammer sandsynligvis fra verdensrummet.
Solen og planeterne blev formentlig dannet for omkring 4.5 mia. år siden da en lille del af en sky af gas og støv i verdensrummet - en såkaldt molekylesky - faldt sammen på grund af dens egen tyngdekraft.
I molekyleskyen var der også en lille del vand, som på en eller anden måde fandt vej til vores egen Jord. Helt præcist hvordan, er et af de store ubesvarede spørgsmål i studierne af livets oprindelse på Jorden.
»Disse observationer har åbnet for en helt ny metode til at studere vand i unge solsystemer. De radiobølger, som vi kan observere med teleskoperne, gør det muligt for os at kigge meget dybere ind mod stjernen og dens skive, end det hidtil har været muligt. Vi kan dermed studere de fysiske og kemiske processer der har betydning for hvordan skiven udvikler sig og hvordan planeter bliver dannet,« siger Jes Jørgensen fra Center for Stjerne- og Planetdannelse ved Statens Naturhistoriske Museum.
Jes Jørgensen har lige startet en ny gruppe ved Center for Stjerne- og Planetdannelse ved Statens Naturhistoriske Museum, som fokuserer på netop de spørgsmål.
Han planlægger at benytte bl.a. ESO’s kommende Alma-teleskop, som kan benyttes til at finde vand omkring mange unge stjerner og dermed fastlægge, om mængden af vand og hvor det befinder sig ændrer sig, mens stjernen bliver dannet.


Ítarefni:
![]()
http://www.iop.org/EJ/abstract/2041-8205/710/1/L72
WATER VAPOR IN THE INNER 25 AU OF A YOUNG DISK AROUND A LOW-MASS PROTOSTAR*
2010 ApJ 710 L72-L76 doi: 10.1088/2041-8205/710/1/L72 ![]()
| ||||
Jes K. Jørgensen1,4 and Ewine F. van Dishoeck2,3
1 Argelander-Institut für Astronomie, University of Bonn, Auf dem Hügel 71, D-53121 Bonn, Germany
2 Leiden Observatory, Leiden University, P.O. Box 9513, NL-2300 RA Leiden, The Netherlands
3 Max-Planck Institut für extraterrestrische Physik, Giessenbachstrasse, D-85748 Garching, Germany
4 Current address: Centre for Star and Planet Formation, Natural History Museum of Denmark, University of Copenhagen, Øster Voldgade 5-7, DK-1350 Copenhagen K, Denmark.
E-mail: jes@snm.ku.dk and ewine@strw.leidenuniv.nl
ABSTRACT. Water is one of the key molecules in the physical and chemical evolution of star- and planet-forming regions. We here report the first spatially resolved observation of thermal emission of (an isotopologue of) water with the Plateau de Bure Interferometer toward the deeply embedded Class 0 protostar NGC 1333-IRAS4B. The observations of the H18 2O 31,3-22,0 transition at 203.4 GHz resolve the emission of water toward this source with an extent of about 0![]() 2 corresponding to the inner 25 AU (radius). The H18 2O emission reveals a tentative velocity gradient perpendicular to the extent of the protostellar outflow/jet probed by observations of CO rotational transitions and water masers. The line is narrow,
2 corresponding to the inner 25 AU (radius). The H18 2O emission reveals a tentative velocity gradient perpendicular to the extent of the protostellar outflow/jet probed by observations of CO rotational transitions and water masers. The line is narrow, ![]() 1 km s–1 (FWHM), significantly less than what would be expected for emission from an infalling envelope or accretion shock, but consistent with emission from a disk seen at a low inclination angle. The water column density inferred from these data suggests that the water emitting gas is a thin warm layer containing about 25 M Earth of material, 0.03% of the total disk mass traced by continuum observations.
1 km s–1 (FWHM), significantly less than what would be expected for emission from an infalling envelope or accretion shock, but consistent with emission from a disk seen at a low inclination angle. The water column density inferred from these data suggests that the water emitting gas is a thin warm layer containing about 25 M Earth of material, 0.03% of the total disk mass traced by continuum observations.
Key words: astrochemistry; ISM: abundances; ISM: individual objects (NGC 1333-IRAS4B); protoplanetary disks; stars: formation
* Based on observations carried out with the Institut de Radioastronomie Millimétrique (IRAM) Plateau de Bure Interferometer. IRAM is supported by INSU/CNRS (France), MPG (Germany), and IGN (Spain).
Print publication: Issue 1 (2010 February 10)
Received 2009 October 18, accepted for publication 2010 January 7
Published 2010 January 22
Reyna má að nálgast sjálfa greinina hér.
Heimspeki | Breytt s.d. kl. 10:01 | Slóð | Facebook | Athugasemdir (4)
Föstudagur, 20. nóvember 2009
" Ragnarök - nei ! " Óvenjulegur fyrirlestur Monckton lávarðar í Cambridge. Myndband...

Það er ekki annað hægt en að dást að umhverfinu í Cambridge þar sem fyrirlestur Moncktons lávarðar, Apocalypse - No, um loftslagsmál er haldinn. Sjálfsagt eru Bretar sérfræðingar í að skapa svona hátíðlegt umhverfi í gömlum háskólabæ þar sem tradisjónirnar ráða ríkjum.
Myndbandið hefst á ljúfri tónlist þar sem lordinn gengur prúðbúinn milli fagurra bygginga áleiðis að fyrirlestrasalnum...
Í inngangi fyrirlestursins vitnar hann í Thomas Henry Huxley: "The improver of natural knowledge absolutely refuses to acknowledge authority, as such. For him, scepticism is the highest of duties; blind faith the one unpardonable sin."
Þetta er nokkuð langur fyrirlestur, en enginn verður svikinn af því að horfa og hlusta.
Góða skemmtun og góða helgi 
Apocalypse-No eða Ragnarök-Nei
Stækka má myndina í fullan skjá með takkanum neðst hægra megin. Smella síðan á F11.
Einnig má horfa á myndina hér: http://video.google.com/videoplay?docid=5206383248165214524#
Auðvitað mega menn gjarnan segja álit sitt á lávarðinum og fyrirlestri hans, en bloggarinn ætlar að halda sig til hlés og leyfa Monckton að svara fyrir sig, enda er hann vel fær um það...
P.S. Vilji einhver hlusta á annan fyrirlestur Moncktons þá er hann hér.
---
(Hvað er þetta hér og hér !!! ??? Manni kemur til hugar State of Fear eftir Crichton).
Heimspeki | Breytt 23.11.2009 kl. 08:34 | Slóð | Facebook | Athugasemdir (13)

Um bloggið
Ginnungagap
Efni
Ýmislegt
Loftslag

Teljari
Álverð
Sólin í dag:
(Smella á mynd)
.
Olíuverðið í dag:
Nýjustu færslur
- Kínverskur loftbelgur yfir Ameríku, og Amerískur belgur yfir ...
- Vísindavefurinn: Getum við seinkað klukkunni á Íslandi og fen...
- Sjálfstæðisflokkurinn með tæplega 19% meira fylgi en Samfylki...
- Bjarni Sigurðsson harmonikkusnillingur frá Geysi. Fáein orð...
- Hvers vegna valdi Apple ekki Ísland fyrir gagnaver...?
Heimsóknir
Flettingar
- Í dag (5.7.): 15
- Sl. sólarhring: 19
- Sl. viku: 116
- Frá upphafi: 767721
Annað
- Innlit í dag: 11
- Innlit sl. viku: 85
- Gestir í dag: 11
- IP-tölur í dag: 11
Uppfært á 3 mín. fresti.
Skýringar
Tenglar
Tenglar
Ýmsar vefsíður
- Efnisyfirlit pistla
- Lofthiti - Sjávarstaða - Hafís - Sólvirkni... Beintengdir ferlar
- Club du Soleil Greinar um samaspil sólar og veðurfars
- Stjörnufræðivefurinn
- Astronomy Picture of the Day
- Climate4you
- Watts Up With That?
- World Climate Report
- CO2 Science
- The Reference Frame
- Climate-Audit
- ICECAP
- The Air Went
- Science Sceptical Blog
- Roy Spencer
- Friends of Sience
- Prometheus
- Öldur aldanna. Sjaldan er ein báran stök - einnig í veðurfari? (2003) Vefsíða ÁHB
- Gróðurhúsaáhrif eða eðlilegar sveiflur í virkni sólar? (Grein í Lesbók Mbl. 20. júní 1998) Höfundur Ágúst H. Bjarnason
- Er jörðin að hitna?-Ekki er allt sem sýnist (1998) Vefsíða ÁHB
Uppskriftir
Ýmsar mataruppskriftir
Myndaalbúm
Bloggvinir
-
 majab
majab
-
 ragu
ragu
-
 amadeus
-
 andres08
-
 apalsson
-
 asabjorg
-
 askja
askja
-
 astromix
-
 baldher
-
 biggibraga
-
 bjarkib
-
 bjarnijonsson
-
 bjarnimax
-
 bjorn-geir
-
 blindur
-
 bofs
bofs
-
 brandarar
-
 daliaa
-
 darwin
-
 duddi9
-
 ea
ea
-
 egillsv
-
 einari
-
 einarstrand
-
 elinora
-
 elvira
-
 emilhannes
-
 esv
esv
-
 eyjapeyji
-
 fhg
fhg
-
 finder
-
 finnur
-
 fjarki
-
 flinston
-
 frisk
frisk
-
 gattin
-
 geiragustsson
-
 gillimann
-
 gretaro
-
 gthg
gthg
-
 gudmbjo
-
 gudni-is
-
 gummibraga
-
 gun
gun
-
 gutti
gutti
-
 haddi9001
-
 halldorjonsson
-
 halldors
-
 hlini
hlini
-
 hof
hof
-
 hordurhalldorsson
-
 hreinsamviska
-
 hronnsig
-
 hugdettan
-
 icekeiko
-
 ingibjorgelsa
-
 jakobbjornsson
-
 jakobk
-
 johannesthor
-
 johnnyboy99
-
 jonaa
jonaa
-
 jonasgunnar
-
 jonmagnusson
-
 jonpallv
-
 jonthorolafsson
-
 juliusvalsson
-
 karljg
-
 katrinsnaeholm
-
 kikka
kikka
-
 kje
kje
-
 klarak
-
 kolbrunb
-
 krissiblo
-
 ksh
ksh
-
 kt
kt
-
 lehamzdr
-
 liljabolla
-
 lillagud
-
 lindalea
-
 lucas
lucas
-
 maeglika
-
 maggij
-
 maggiraggi
-
 marinomm
-
 martasmarta
-
 marzibil
-
 mberg
mberg
-
 midborg
-
 minos
minos
-
 morgunbladid
-
 mosi
mosi
-
 mullis
-
 naflaskodun
-
 nimbus
-
 nosejob
-
 omarbjarki
-
 ormurormur
-
 palmig
-
 perlaoghvolparnir
-
 peturmikli
-
 photo
photo
-
 possi
possi
-
 prakkarinn
-
 raggibjarna
-
 rattati
-
 ravenyonaz
-
 redlion
-
 rs1600
-
 rynir
rynir
-
 saemi7
-
 sesseljamaria
-
 sigfus
-
 sigurgeirorri
-
 sjalfstaedi
-
 sjerasigvaldi
-
 skari60
-
 skulablogg
-
sleggjudomarinn
-
stebbix
-
 steinibriem
-
 steinnhaf
-
 stinajohanns
-
 stjornuskodun
-
 storibjor
-
 straitjacket
-
 summi
summi
-
 tannibowie
-
 thil
thil
-
 thjodarskutan
-
 throsturg
-
 toro
toro
-
 tryggvigunnarhansen
-
 valdimarjohannesson
-
 valdinn
-
 vefritid
-
 vey
vey
-
 vidhorf
-
 vig
vig
-
 visindin
-
 vulkan
-
 kristjan9
-
 arkimedes
-
 kliddi
-
 eliasbe
Eldri færslur
- Febrúar 2023
- Janúar 2019
- Maí 2018
- Júlí 2017
- Maí 2017
- Febrúar 2017
- Janúar 2017
- Nóvember 2016
- Október 2016
- September 2016
- Júlí 2016
- Apríl 2016
- Mars 2016
- Febrúar 2016
- Janúar 2016
- Desember 2015
- Nóvember 2015
- Október 2015
- Ágúst 2015
- Júní 2015
- Maí 2015
- Apríl 2015
- Mars 2015
- Febrúar 2015
- Janúar 2015
- Desember 2014
- Nóvember 2014
- Október 2014
- September 2014
- Ágúst 2014
- Júlí 2014
- Júní 2014
- Maí 2014
- Apríl 2014
- Mars 2014
- Febrúar 2014
- Janúar 2014
- Desember 2013
- Nóvember 2013
- Október 2013
- September 2013
- Ágúst 2013
- Júlí 2013
- Júní 2013
- Maí 2013
- Apríl 2013
- Mars 2013
- Febrúar 2013
- Janúar 2013
- Desember 2012
- Nóvember 2012
- September 2012
- Ágúst 2012
- Júlí 2012
- Júní 2012
- Maí 2012
- Apríl 2012
- Mars 2012
- Febrúar 2012
- Janúar 2012
- Desember 2011
- Nóvember 2011
- Október 2011
- September 2011
- Ágúst 2011
- Júlí 2011
- Júní 2011
- Apríl 2011
- Mars 2011
- Febrúar 2011
- Janúar 2011
- Desember 2010
- Nóvember 2010
- Október 2010
- September 2010
- Ágúst 2010
- Júlí 2010
- Júní 2010
- Maí 2010
- Apríl 2010
- Mars 2010
- Febrúar 2010
- Janúar 2010
- Desember 2009
- Nóvember 2009
- Október 2009
- September 2009
- Ágúst 2009
- Júlí 2009
- Júní 2009
- Maí 2009
- Apríl 2009
- Mars 2009
- Febrúar 2009
- Janúar 2009
- Desember 2008
- Nóvember 2008
- Október 2008
- September 2008
- Ágúst 2008
- Júlí 2008
- Júní 2008
- Maí 2008
- Apríl 2008
- Mars 2008
- Febrúar 2008
- Janúar 2008
- Desember 2007
- Nóvember 2007
- Október 2007
- September 2007
- Ágúst 2007
- Júlí 2007
- Júní 2007
- Apríl 2007
- Mars 2007
- Febrúar 2007
- Janúar 2007
- Desember 2006
- Nóvember 2006
- Október 2006
- September 2006
Færsluflokkar
- Bloggar
- Bækur
- Dægurmál
- Evrópumál
- Ferðalög
- Fjármál
- Fjölmiðlar
- Heilbrigðismál
- Heimspeki
- Íþróttir
- Kjaramál
- Kvikmyndir
- Lífstíll
- Ljóð
- Löggæsla
- Mannréttindi
- Matur og drykkur
- Menning og listir
- Menntun og skóli
- Samgöngur
- Sjónvarp
- Spaugilegt
- Spil og leikir
- Stjórnmál og samfélag
- Sveitarstjórnarkosningar
- Tónlist
- Trúmál
- Trúmál og siðferði
- Tölvur og tækni
- Umhverfismál
- Utanríkismál/alþjóðamál
- Vefurinn
- Viðskipti og fjármál
- Vinir og fjölskylda
- Vísindi og fræði